Loading, please wait...

HWPure Header Banner


Hardware Image

Intel Core i5 1135G7

CPUID : 11th Gen Intel(R) Core(TM) i5-1135G7 @ 2.40GHz
Architecture : x86
Codename : Tiger Lake-U
L3 Cache : 8MB
Clock : 2.40GHz - 4.20GHz
Core/Thread : 4/8
TDP : 28W
Technology : 10nm
Socket : FCBGA1449
IGPU : Intel Iris Xe Graphics Mobile G7

See more specification...

Friday, 06 August 2021 04:34 | Update at 1 month ago
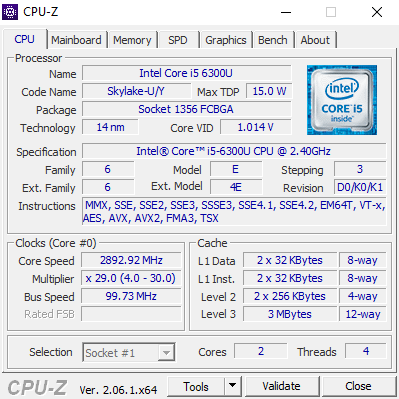
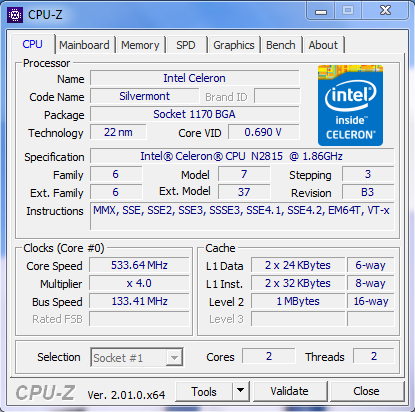

4 Core
8 Thread
Mobile Segmen
10 nm Technology
2.4 GHz Base Clock
4.2 GHz Turbo Clock
x86 Architecture

Hardware Benchmark Record

This table displays the scores or sequential read & write speeds (for storage types) of various synthetic benchmark applications commonly used to test hardware performance. You can click on the score column to view the submissions page by ID. At that URL, you can browse the submitted results of each application, including viewing screenshots of the benchmark results. For screenshots of benchmark results, you can click the "View" button in the screenshot column.

In total, there are 61 submissions across 61 different benchmark applications, each testing the hardware from a unique angle. This variety allows you to draw a more comprehensive conclusion about the hardware's real-world performance.

No Benchmark Score HWBOT/Benchmark URL Facebook URL Screenshot
3DMark11 - Physics 10260 points https://hwbot.org/submission/4966169 https://bit.ly/3weObMb
3DMark CPU PROFILE 1 THREAD 846 marks https://hwbot.org/submission/4966168 https://www.facebook.com/hakimnu.id/posts/3259205544312086
3DMark CPU PROFILE MAX 3441 marks https://hwbot.org/submission/4966167 https://www.facebook.com/hakimnu.id/posts/3259205544312086
7-Zip 30697 MIPS https://hwbot.org/submission/4927939 https://bit.ly/3AzqgJX
AIDA64 GPGPU Benchmark - Single Precision FLOPS 484.7 GFLOPS

[ not available ]

https://bit.ly/3wJUQh5
AnTuTu Benchmark (BETA) - CPU 298825 points

[ not available ]

https://bit.ly/3NQ9dqy
Blender (CPU) - BMW Scene 9min, 58sec, 38ms

[ not available ]

https://bit.ly/3OmPfEz
Blender (CPU) - Classroom Scene 18min, 11sec, 10ms

[ not available ]

https://bit.ly/3mXHg58
Cinebench - 2003 4548 cb https://hwbot.org/submission/4974593 https://www.facebook.com/hakimnu.id/posts/3260938427472131
Cinebench - 2003 Single Core 1446 cb

[ not available ]

https://www.facebook.com/hakimnu.id/posts/3260938427472131
Cinebench - R11.5 10.37 pts https://hwbot.org/submission/4974594 https://bit.ly/385KgZk
Cinebench - R11.5 with BenchMate 9.45 pts https://hwbot.org/submission/4935888 https://bit.ly/3Az546T
Cinebench - R11.5 Single Core 2.19 pts

[ not available ]

https://www.facebook.com/hakimnu.id/posts/3261523290746978
Cinebench - R15 EXTREME! Multi Core 211 cb

[ not available ]

https://www.facebook.com/hakimnu.id/posts/3220638184835489
Cinebench - R15 EXTREME! Single Core 52 cb

[ not available ]

https://www.facebook.com/hakimnu.id/posts/3220638184835489
Cinebench - R15 936 cb https://hwbot.org/submission/4974966 https://bit.ly/3yLBb2W
Cinebench - R15 with BenchMate 854 cb https://hwbot.org/submission/4927955 https://bit.ly/3c6hJVy
Cinebench - R15 Single Core 199 cb

[ not available ]

https://bit.ly/3yLBb2W
Cinebench - R20 with BenchMate 1995 pts https://hwbot.org/submission/4927980 https://bit.ly/3Nx1n5v
Cinebench - R20 2195 pts https://hwbot.org/submission/4974967 https://bit.ly/3wBKNdQ
Cinebench - R20 Single Core 507 pts

[ not available ]

https://bit.ly/3wBKNdQ
Cinebench - R23 Multi Core 5181 pts

[ not available ]

https://bit.ly/3wAyjV9
Cinebench - R23 Multi Core with BenchMate 5661 pts https://hwbot.org/submission/5090907 https://bit.ly/3CtoIkI
Cinebench - R23 Single Core 1302 pts

[ not available ]

https://bit.ly/3wAyjV9
Cinebench - R23 Single Core with BenchMate 1334 pts https://hwbot.org/submission/4927994 https://bit.ly/3wAyjV9
CPU-Z Benchmark - Multi Thread 2462.5 marks

[ not available ]

https://bit.ly/3QWLeI9
CPU-Z Benchmark - Single Thread 504 marks

[ not available ]

https://bit.ly/3QWLeI9
CPU Frequency 3795.05 MHz https://hwbot.org/submission/4941854 -
Geekbench3 - Multi Core 17993 points https://hwbot.org/submission/5097451 https://bit.ly/3RR147i
Geekbench3 - Single Core 4933 points https://hwbot.org/submission/5097452 https://bit.ly/3RR147i
Geekbench4 - Multi Core 19133 points https://hwbot.org/submission/5095755 https://bit.ly/3yB2JXT
Geekbench4 - Single Core 6098 points https://hwbot.org/submission/5095757 https://bit.ly/3yB2JXT
Geekbench5 - Multi Core 4699 points https://hwbot.org/submission/5091348 https://bit.ly/3V8N2AI
Geekbench5 - Single Core 1403 points https://hwbot.org/submission/5091351 https://bit.ly/3V8N2AI
Geekbench6 - Multi Core 5275 points https://hwbot.org/submission/5202608 https://bit.ly/40Z3jLs
Geekbench6 - Single Core 1784 points https://hwbot.org/submission/5202617 https://bit.ly/40Z3jLs
GPUPI for CPU - 100M 26sec, 772ms https://hwbot.org/submission/4963478 https://bit.ly/3b8DYcE
GPUPI for CPU - 1B 5min, 49sec, 840ms https://hwbot.org/submission/4963477 https://bit.ly/3b8DYcE
GPUPI for CPU v.3.3 - 100M 15sec, 271ms https://hwbot.org/submission/4963474 https://bit.ly/3zNLtQK
GPUPI for CPU v.3.3 - 1B 4min, 6sec, 707ms https://hwbot.org/submission/4963473 https://bit.ly/3zNLtQK
HWBOT x265 - 1080P 29.688 FPS https://hwbot.org/submission/4972663 https://bit.ly/3xAB60S
HWBOT x265 - 4K 6.696 FPS https://hwbot.org/submission/4972678 https://bit.ly/3xAB60S
HyperPi - 1M 12sec, 87ms

[ not available ]

[ not available ]

HyperPi - 32M 28sec, 871ms

[ not available ]

[ not available ]

PassMark - PerformanceTest (CPU Mark) 11521 marks https://www.passmark.com/baselines/V10/display.php?id=167224256362 http://bit.ly/3i2NT78
PCMark 7 8651 marks https://hwbot.org/submission/4963111 https://bit.ly/3MfJcRA
PCMark10 4692 marks https://hwbot.org/submission/4963094 https://bit.ly/3MfJcRA
PiFast 15sec, 570ms https://hwbot.org/submission/4962855 https://bit.ly/3mSgCe9
PiFast with BenchMate 16sec, 120ms https://hwbot.org/submission/4928045 -
SuperPi - 1M 8sec, 157ms https://hwbot.org/submission/4976140 https://bit.ly/3NISUwG
SuperPi - 1M with BenchMate 7sec, 960ms https://hwbot.org/submission/5090925 https://bit.ly/3RzS6eD
SuperPi - 32M 7min, 8sec, 285ms https://hwbot.org/submission/4967810 https://bit.ly/3NISUwG
SuperPi - 32M with BenchMate 6min, 52sec, 446ms https://hwbot.org/submission/5090928 https://bit.ly/3RzS6eD
WinRAR - Multi Thread 8781 KB/s

[ not available ]

https://www.facebook.com/hakimnu.id/posts/3339129829652990
WinRAR - Single Thread 1800 KB/s

[ not available ]

https://www.facebook.com/hakimnu.id/posts/3339129829652990
wPrime - 32M 6sec, 334ms https://hwbot.org/submission/4976168 https://bit.ly/3MIc19w
wPrime - 32M with BenchMate 5sec, 793ms https://hwbot.org/submission/5090930 https://bit.ly/3dZXIB7
wPrime - 1024M 3min, 18sec, 987ms https://hwbot.org/submission/4976136 https://bit.ly/3MIc19w
wPrime - 1024M with BenchMate 3min, 3sec, 767ms https://hwbot.org/submission/5090932 https://bit.ly/3dZXIB7
y-cruncher - Pi-25m 1sec, 343ms https://hwbot.org/submission/4965933 https://bit.ly/3xC2ytV
y-cruncher - Pi-1b 1min, 24sec, 842ms https://hwbot.org/submission/4928028 https://bit.ly/39Oahg9

Media Gallery

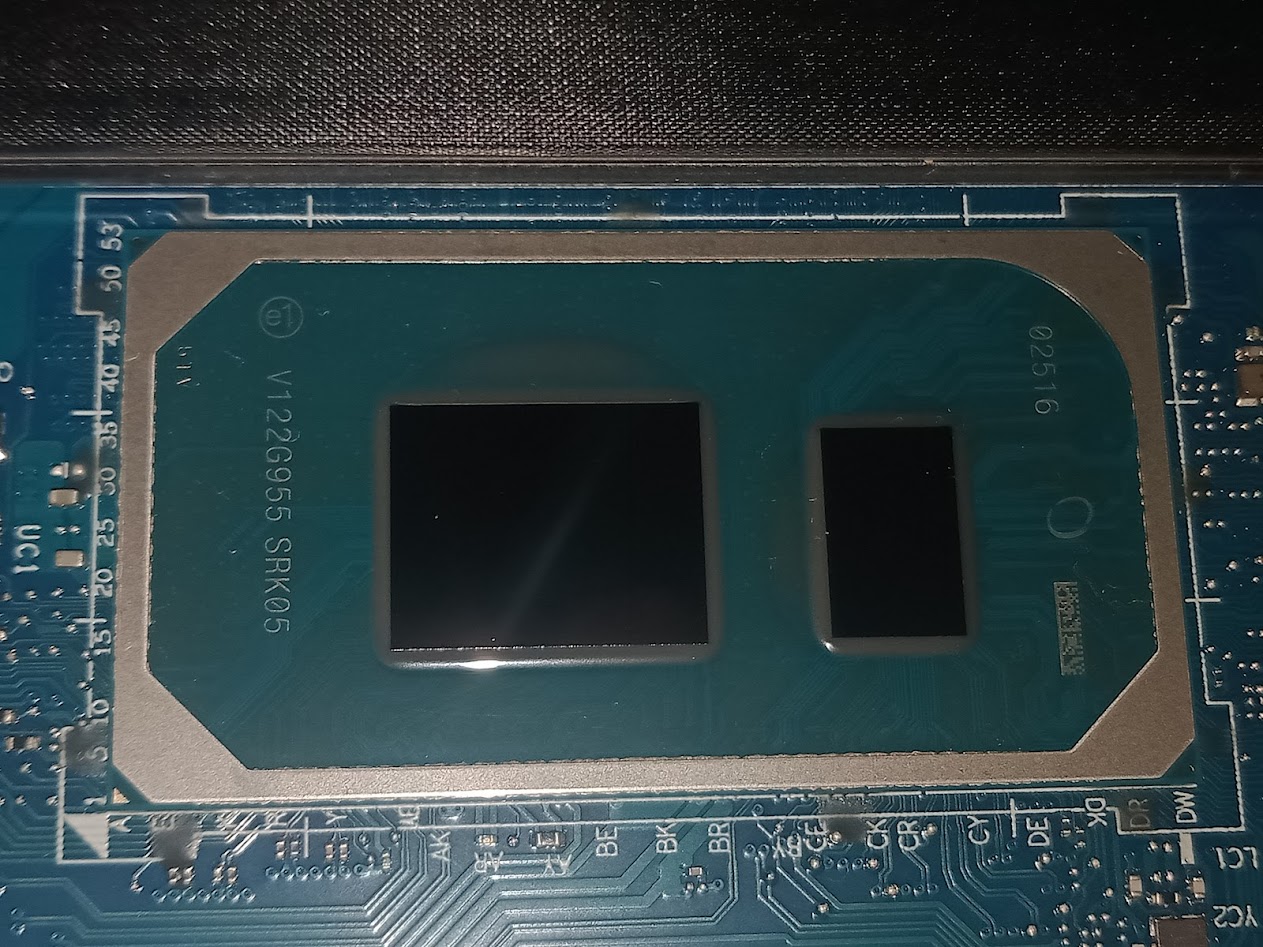
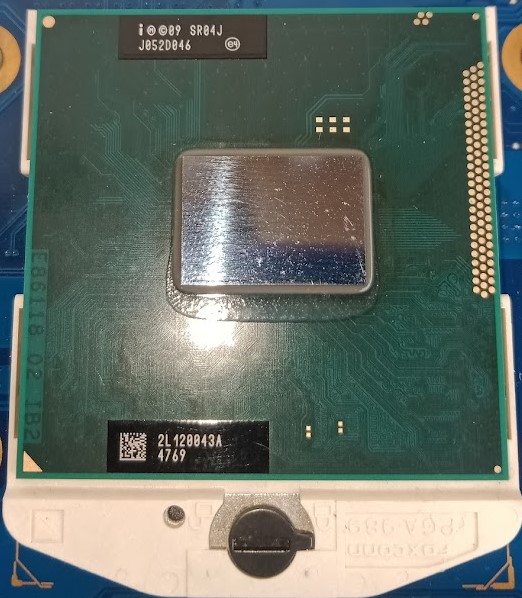
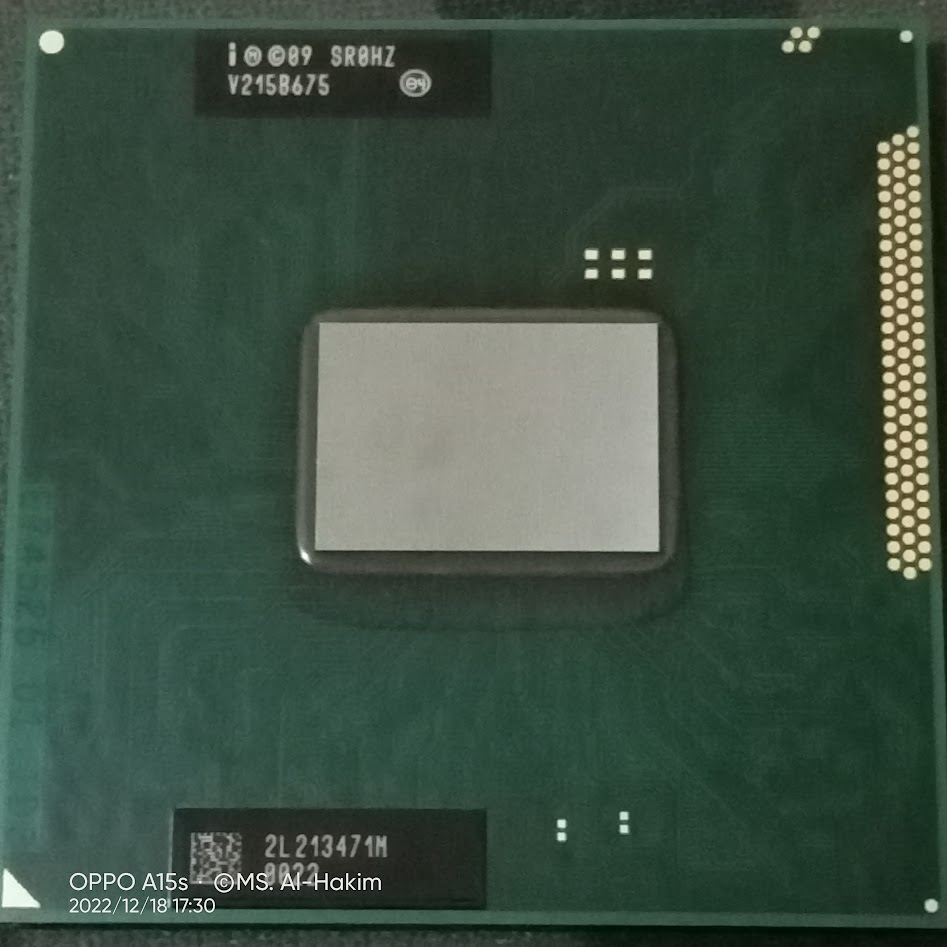
A collection of photos of tested hardware. These images can help you identify the physical form, model, and variant of the hardware in question. These photos are from our own documentation, and if they are not available we may not be able to document them.


Nearby Competitors

Shows two other devices with slightly higher scores and two others with slightly lower scores on the same benchmarks. Useful to see how competitive these devices are.

3DMark CPU PROFILE MAX
Rank Hardware Score Performance Percentage
Higher Intel Core i5 1335U 4462 marks 129.7%
This Hardware Intel Core i5 1135G7 3441 marks 100%
Lower Intel Core i5 6300U 924 marks 26.9%
3DMark CPU PROFILE 1 THREAD
Rank Hardware Score Performance Percentage
Higher Intel Core i5 1335U 975 marks 115.2%
This Hardware Intel Core i5 1135G7 846 marks 100%
Lower Intel Core i5 6300U 466 marks 55.1%
3DMark11 - Physics
Rank Hardware Score Performance Percentage
This Hardware Intel Core i5 1135G7 10260 points 100%
7-Zip
Rank Hardware Score Performance Percentage
Higher AMD Ryzen 3 5300U 33803 MIPS 110.1%
Higher Intel Core i5 1335U 52680 MIPS 171.6%
This Hardware Intel Core i5 1135G7 30697 MIPS 100%
Lower Intel Core i5 6300U 10900 MIPS 35.5%
Lower Intel Core i7 720QM 10448 MIPS 34.0%
Cinebench - 2003
Rank Hardware Score Performance Percentage
Higher Intel Core i5 1335U 6677 cb 146.8%
Higher Intel Core i7 11700 8154 cb 179.3%
This Hardware Intel Core i5 1135G7 4548 cb 100%
Lower Intel Core i7 7700K 4315 cb 94.9%
Lower Intel Core i5 6300U 1601 cb 35.2%
Cinebench - R11.5
Rank Hardware Score Performance Percentage
Higher Intel Core i5 1335U 19.45 pts 187.6%
Higher Intel Core i7 11700 23.63 pts 227.9%
This Hardware Intel Core i5 1135G7 10.37 pts 100%
Lower Intel Core i7 7700K 9.59 pts 92.5%
Lower Intel Core i5 6300U 2.91 pts 28.1%
Cinebench - R11.5 with BenchMate
Rank Hardware Score Performance Percentage
Higher AMD Ryzen 3 5300U 10.38 pts 109.8%
This Hardware Intel Core i5 1135G7 9.45 pts 100%
Lower AMD E1-1200 0.52 pts 5.5%
Cinebench - R15
Rank Hardware Score Performance Percentage
Higher Intel Core i5 1335U 1350 cb 144.2%
Higher Intel Core i9 11900F 2034 cb 217.3%
This Hardware Intel Core i5 1135G7 936 cb 100%
Lower Intel Core i7 7700K 867 cb 92.6%
Lower AMD Ryzen 3 5300U 851 cb 90.9%
Cinebench - R15 with BenchMate
Rank Hardware Score Performance Percentage
This Hardware Intel Core i5 1135G7 854 cb 100%
Lower AMD E1-1200 44 cb 5.2%
Cinebench - R15 Single Core
Rank Hardware Score Performance Percentage
This Hardware Intel Core i5 1135G7 199 cb 100%
Lower AMD Ryzen 3 5300U 163 cb 81.9%
Lower Intel Core i7 720QM 57 cb 28.6%
Cinebench - R20
Rank Hardware Score Performance Percentage
Higher Intel Core i7 7700K 2222 pts 101.2%
Higher Intel Core i5 1335U 3066 pts 139.7%
This Hardware Intel Core i5 1135G7 2195 pts 100%
Lower Intel Core i5 6300U 656 pts 29.9%
Lower Intel Core i7 720QM 527 pts 24.0%
Cinebench - R20 Single Core
Rank Hardware Score Performance Percentage
This Hardware Intel Core i5 1135G7 507 pts 100%
Lower Intel Core i7 720QM 118 pts 23.3%
Lower AMD E1-1200 43 pts 8.5%
Cinebench - R20 with BenchMate
Rank Hardware Score Performance Percentage
This Hardware Intel Core i5 1135G7 1995 pts 100%
Lower AMD E1-1200 80 pts 4.0%
Cinebench - R23 Single Core
Rank Hardware Score Performance Percentage
This Hardware Intel Core i5 1135G7 1302 pts 100%
Lower AMD Ryzen 3 5300U 990 pts 76.0%
Cinebench - R23 Multi Core
Rank Hardware Score Performance Percentage
Higher Intel Core i7 7700K 5767 pts 111.3%
Higher Intel Core i7 11700 11206 pts 216.3%
This Hardware Intel Core i5 1135G7 5181 pts 100%
Lower AMD Ryzen 3 5300U 5147 pts 99.3%
Cinebench - R23 Single Core with BenchMate
Rank Hardware Score Performance Percentage
Higher Intel Core i5 1335U 1611 pts 120.8%
This Hardware Intel Core i5 1135G7 1334 pts 100%
Lower Intel Core i5 6300U 777 pts 58.2%
Lower Intel Core i7 720QM 301 pts 22.6%
CPU Frequency
Rank Hardware Score Performance Percentage
This Hardware Intel Core i5 1135G7 3795.05 MHz 100%
Lower AMD E1-1200 3549.92 MHz 93.5%
GPUPI for CPU - 100M
Rank Hardware Score Performance Percentage
This Hardware Intel Core i5 1135G7 26sec, 772ms 100%
Lower AMD E1-1200 11min, 20sec, 588ms 2,542.2%
Lower Intel Core i7 720QM 2min, 22sec, 383ms 531.8%
GPUPI for CPU - 1B
Rank Hardware Score Performance Percentage
This Hardware Intel Core i5 1135G7 5min, 49sec, 840ms 100%
Lower AMD E1-1200 2h, 57min, 9sec, 173ms 3,038.3%
Lower AMD E1-1200 2h, 35min, 28sec, 985ms 2,666.6%
GPUPI for CPU v.3.3 - 100M
Rank Hardware Score Performance Percentage
This Hardware Intel Core i5 1135G7 15sec, 271ms 100%
Lower AMD E1-1200 15min, 49sec, 435ms 6,217.2%
Lower Intel Core i7 720QM 1min, 25sec, 91ms 557.2%
GPUPI for CPU v.3.3 - 1B
Rank Hardware Score Performance Percentage
This Hardware Intel Core i5 1135G7 4min, 6sec, 707ms 100%
Lower Intel Core i7 720QM 38min, 25sec, 60ms 934.3%
Lower Intel Core i5 6300U 21min, 42sec, 40ms 527.8%
HWBOT x265 - 1080P
Rank Hardware Score Performance Percentage
This Hardware Intel Core i5 1135G7 29.688 FPS 100%
Lower Intel Core i5 6300U 9.555 FPS 32.2%
Lower Intel Core i7 720QM 4.569 FPS 15.4%
HWBOT x265 - 4K
Rank Hardware Score Performance Percentage
This Hardware Intel Core i5 1135G7 6.696 FPS 100%
Lower Intel Core i5 6300U 2.148 FPS 32.1%
Lower AMD E1-1200 0.155 FPS 2.3%
PCMark 7
Rank Hardware Score Performance Percentage
This Hardware Intel Core i5 1135G7 8651 marks 100%
Lower Intel Core i5 6300U 5020 marks 58.0%
Lower Intel Core i7 720QM 1630 marks 18.8%
PCMark10
Rank Hardware Score Performance Percentage
Higher Intel Core i5 1335U 5377 marks 114.6%
This Hardware Intel Core i5 1135G7 4692 marks 100%
Lower Intel Core i5 6300U 2677 marks 57.1%
Lower Intel Core i7 720QM 1138 marks 24.3%
PiFast
Rank Hardware Score Performance Percentage
Higher Intel Core i7 11700 12sec, 510ms 80.3%
Higher Intel Core i5 1335U 13sec, 990ms 89.9%
This Hardware Intel Core i5 1135G7 15sec, 570ms 100%
Lower AMD C-60 2min, 14sec, 820ms 865.9%
Lower AMD E1-1200 1min, 49sec, 900ms 705.8%
PiFast with BenchMate
Rank Hardware Score Performance Percentage
This Hardware Intel Core i5 1135G7 16sec, 120ms 100%
Lower AMD E1-1200 1min, 50sec, 260ms 684.0%
Lower AMD Ryzen 3 5300U 20sec, 820ms 129.2%
SuperPi - 1M
Rank Hardware Score Performance Percentage
Higher Intel Core i7 11700 6sec, 921ms 84.8%
Higher Intel Core i5 1335U 7sec, 92ms 86.9%
This Hardware Intel Core i5 1135G7 8sec, 157ms 100%
Lower AMD C-60 1min, 139ms 737.3%
Lower AMD E1-1200 55sec, 754ms 683.5%
SuperPi - 32M
Rank Hardware Score Performance Percentage
Higher Intel Core i5 1335U 6min, 38sec, 548ms 93.1%
This Hardware Intel Core i5 1135G7 7min, 8sec, 285ms 100%
Lower AMD C-60 52min, 10sec, 800ms 731.0%
Lower AMD E1-1200 45min, 28sec, 176ms 637.0%
wPrime - 1024M
Rank Hardware Score Performance Percentage
Higher Intel Core i5 1335U 3min, 3sec, 230ms 92.1%
This Hardware Intel Core i5 1135G7 3min, 18sec, 987ms 100%
Lower AMD E1-1200 36min, 6sec, 64ms 1,088.5%
Lower AMD A6-3400M 13min, 40sec, 939ms 412.6%
wPrime - 32M
Rank Hardware Score Performance Percentage
Higher Intel Core i5 1335U 3sec, 985ms 62.9%
This Hardware Intel Core i5 1135G7 6sec, 334ms 100%
Lower AMD E1-1200 1min, 8sec, 78ms 1,074.8%
Lower Intel Celeron N2815 47sec, 267ms 746.2%
y-cruncher - Pi-1b
Rank Hardware Score Performance Percentage
This Hardware Intel Core i5 1135G7 1min, 24sec, 842ms 100%
Lower Intel Core i5 6300U 5min, 20sec, 566ms 377.8%
y-cruncher - Pi-25m
Rank Hardware Score Performance Percentage
Higher Intel Core i5 1335U 1sec, 61ms 79.0%
This Hardware Intel Core i5 1135G7 1sec, 343ms 100%
Lower AMD E1-1200 1min, 10sec, 49ms 5,215.9%
Lower AMD A6-3400M 17sec, 682ms 1,316.6%
WinRAR - Multi Thread
Rank Hardware Score Performance Percentage
This Hardware Intel Core i5 1135G7 8781 KB/s 100%
Lower Intel Core i5 6300U 3001 KB/s 34.2%
Lower AMD E1-1200 720 KB/s 8.2%
WinRAR - Single Thread
Rank Hardware Score Performance Percentage
This Hardware Intel Core i5 1135G7 1800 KB/s 100%
Lower Intel Core i5 6300U 1075 KB/s 59.7%
Lower AMD E1-1200 402 KB/s 22.3%
CPU-Z Benchmark - Multi Thread
Rank Hardware Score Performance Percentage
Higher Intel Core i5 1335U 4589.9 points 186.4%
This Hardware Intel Core i5 1135G7 2462.5 marks 100%
Lower Intel Core i5 6300U 817.6 points 33.2%
Lower Intel Core 2 Duo E7500 225.2 points 9.1%
CPU-Z Benchmark - Single Thread
Rank Hardware Score Performance Percentage
Higher Intel Core i5 1335U 682.1 points 135.3%
This Hardware Intel Core i5 1135G7 504 marks 100%
Lower Intel Core i5 6300U 289.8 points 57.5%
Lower Intel Core 2 Duo E7500 113.2 points 22.5%
Cinebench - R15 EXTREME! Multi Core
Rank Hardware Score Performance Percentage
This Hardware Intel Core i5 1135G7 211 cb 100%
Lower AMD E1-1200 11 cb 5.2%
Cinebench - R15 EXTREME! Single Core
Rank Hardware Score Performance Percentage
This Hardware Intel Core i5 1135G7 52 cb 100%
Lower AMD E1-1200 6 cb 11.5%
AnTuTu Benchmark (BETA) - CPU
Rank Hardware Score Performance Percentage
This Hardware Intel Core i5 1135G7 298825 points 100%
Lower AMD E1-1200 17111 points 5.7%
Blender (CPU) - BMW Scene
Rank Hardware Score Performance Percentage
This Hardware Intel Core i5 1135G7 9min, 58sec, 38ms 100%
Blender (CPU) - Classroom Scene
Rank Hardware Score Performance Percentage
This Hardware Intel Core i5 1135G7 18min, 11sec, 10ms 100%
AIDA64 GPGPU Benchmark - Single Precision FLOPS
Rank Hardware Score Performance Percentage
Higher AMD Ryzen 3 5300U 497.6 GFLOPS 102.7%
Higher Intel Core i7 7700K 554.8 GFLOPS 114.5%
This Hardware Intel Core i5 1135G7 484.7 GFLOPS 100%
Lower AMD E1-1200 10.79 GFLOPS 2.2%
Cinebench - 2003 Single Core
Rank Hardware Score Performance Percentage
This Hardware Intel Core i5 1135G7 1446 cb 100%
Lower AMD E1-1200 159 CB 11.0%
Cinebench - R11.5 Single Core
Rank Hardware Score Performance Percentage
This Hardware Intel Core i5 1135G7 2.19 pts 100%
Lower Intel Core i7 720QM 0.60 pts 27.4%
Lower AMD E1-1200 0.28 pts 12.8%
wPrime - 32M with BenchMate
Rank Hardware Score Performance Percentage
Higher AMD Ryzen 3 5300U 5sec, 366ms 92.6%
This Hardware Intel Core i5 1135G7 5sec, 793ms 100%
Lower AMD E1-1200 1min, 8sec, 78ms 1,175.2%
wPrime - 1024M with BenchMate
Rank Hardware Score Performance Percentage
Higher AMD Ryzen 3 5300U 2min, 44sec, 977ms 89.8%
This Hardware Intel Core i5 1135G7 3min, 3sec, 767ms 100%
Lower AMD E1-1200 35min, 29sec, 208ms 1,158.6%
SuperPi - 1M with BenchMate
Rank Hardware Score Performance Percentage
This Hardware Intel Core i5 1135G7 7sec, 960ms 100%
Lower AMD E1-1200 55sec, 195ms 693.4%
Lower AMD Ryzen 3 5300U 10sec, 633ms 133.6%
SuperPi - 32M with BenchMate
Rank Hardware Score Performance Percentage
This Hardware Intel Core i5 1135G7 6min, 52sec, 446ms 100%
Lower AMD E1-1200 45min, 5sec, 892ms 656.1%
Lower Intel Core i7 720QM 22min, 4sec, 723ms 321.2%
Geekbench5 - Multi Core
Rank Hardware Score Performance Percentage
Higher Intel Core i5 1335U 8114 points 172.7%
This Hardware Intel Core i5 1135G7 4699 points 100%
Lower Qualcomm SM6225 Snapdragon 680 4G 1624 points 34.6%
Lower Intel Core i5 6300U 1397 points 29.7%
Geekbench5 - Single Core
Rank Hardware Score Performance Percentage
Higher Intel Core i5 1335U 1698 points 121.0%
This Hardware Intel Core i5 1135G7 1403 points 100%
Lower Intel Core i5 6300U 711 points 50.7%
Lower Intel Core i3 2330M 410 points 29.2%
Cinebench - R23 Multi Core with BenchMate
Rank Hardware Score Performance Percentage
Higher Intel Core i5 1335U 8031 pts 141.9%
This Hardware Intel Core i5 1135G7 5661 pts 100%
Lower Intel Core i5 6300U 1477 pts 26.1%
Lower Intel Core i7 720QM 1024 pts 18.1%
Geekbench3 - Multi Core
Rank Hardware Score Performance Percentage
Higher Intel Core i5 1335U 31332 points 174.1%
This Hardware Intel Core i5 1135G7 17993 points 100%
Lower Qualcomm SM6225 Snapdragon 680 4G 8267 points 45.9%
Lower Intel Core i5 6300U 5290 points 29.4%
Geekbench3 - Single Core
Rank Hardware Score Performance Percentage
Higher Intel Core i5 1335U 6182 points 125.3%
This Hardware Intel Core i5 1135G7 4933 points 100%
Lower Intel Core i5 6300U 2561 points 51.9%
Lower Qualcomm SM6225 Snapdragon 680 4G 2027 points 41.1%
Geekbench4 - Multi Core
Rank Hardware Score Performance Percentage
Higher Intel Core i5 1335U 31691 points 165.6%
This Hardware Intel Core i5 1135G7 19133 points 100%
Lower Qualcomm SM6225 Snapdragon 680 4G 6470 points 33.8%
Lower Intel Core i5 6300U 6112 points 31.9%
Geekbench4 - Single Core
Rank Hardware Score Performance Percentage
Higher Intel Core i5 1335U 7387 points 121.1%
This Hardware Intel Core i5 1135G7 6098 points 100%
Lower Intel Core i5 6300U 3309 points 54.3%
Lower Intel Core i3 2330M 2239 points 36.7%
PassMark - PerformanceTest (CPU Mark)
Rank Hardware Score Performance Percentage
This Hardware Intel Core i5 1135G7 11521 marks 100%
Lower Qualcomm SM6225 Snapdragon 680 4G 5204 marks 45.2%
Lower MediaTek MT6765 Helio P35 3742 marks 32.5%
HyperPi - 1M
Rank Hardware Score Performance Percentage
This Hardware Intel Core i5 1135G7 12sec, 87ms 100%
Lower AMD E1-1200 58sec, 1ms 479.9%
HyperPi - 32M
Rank Hardware Score Performance Percentage
This Hardware Intel Core i5 1135G7 28sec, 871ms 100%
Lower AMD E1-1200 47min, 45sec, 47ms 9,923.6%
Geekbench6 - Single Core
Rank Hardware Score Performance Percentage
Higher Intel Core i5 1335U 2285 points 128.1%
This Hardware Intel Core i5 1135G7 1784 points 100%
Lower Qualcomm SM7435-AB Snapdragon 7s Gen 2 1026 points 57.5%
Lower Intel Core i5 6300U 911 points 51.1%
Geekbench6 - Multi Core
Rank Hardware Score Performance Percentage
Higher Intel Core i5 1335U 8689 points 164.7%
This Hardware Intel Core i5 1135G7 5275 points 100%
Lower Qualcomm SM7435-AB Snapdragon 7s Gen 2 2916 points 55.3%
Lower Intel Core i5 6300U 1593 points 30.2%

About i5-1135G7

The Intel Core i5-1135G7 is a quad-core mobile processor introduced in late 2020 as part of Intel’s 11th generation Tiger Lake lineup. Designed for thin and light laptops, this CPU delivers a strong balance of performance, power efficiency, and modern features, making it a popular choice for both casual users and professionals. Featuring 4 cores and 8 threads through Hyper-Threading Technology, it operates at a base clock of 2.4 GHz and can reach up to 4.2 GHz with Intel Turbo Boost, ensuring smooth multitasking and snappy responsiveness for day-to-day applications.

Built using Intel’s advanced 10nm SuperFin process, the i5-1135G7 offers improved efficiency and thermal performance over previous 14nm generations. With a configurable TDP ranging from 12W to 28W, OEMs can adjust the performance envelope depending on the device’s thermal design. The standout feature of this processor is its integrated Intel Iris Xe Graphics, equipped with 80 Execution Units and a dynamic frequency of up to 1.3 GHz. Compared to older Intel UHD Graphics, Iris Xe brings a massive leap in performance, capable of handling casual gaming, 4K video playback, and GPU-accelerated workloads like video rendering or image editing.

In benchmark tests such as Cinebench R23, the i5-1135G7 scores around 5661 points (multi-core) and 1334 points (single-core), showcasing excellent performance for a low-power chip. These scores reflect its capability to handle modern productivity software, web-based workflows, and even creative tools like Adobe Photoshop or Premiere Pro though for heavier workloads, a higher-end CPU may still be recommended.

Real-world performance testing was done on a Lenovo IdeaPad Slim 3i 14ITL6, a budget-to-midrange laptop equipped with 12GB DDR4 3200MHz dual-channel memory (8+4 configuration). This setup, combined with Windows 10 and Windows 11 22H2, allows the i5-1135G7 to fully utilize its integrated GPU and high-speed memory interface for a snappy and responsive user experience.

Whether you're a student, a professional, or a casual user looking for a capable, energy-efficient processor, the Intel Core i5-1135G7 stands out as one of the best value choices in the ultrabook category.

Hardware Detail:

Device: Lenovo IdeaPad Slim 3i 14ITL6
RAM: 12GB DDR4 3200MHz Dual Channel (8+4)
OS: Windows 10, Windows 11 22H2


Need Compare to Other Hardware?

You can compare Intel Core i5 1135G7 hardware with related hardware below


Related Hardware

Explore other Processors hardware that are related to Intel Core i5 1135G7