GEEKBENCH3 - SINGLE CORE
13
of Total Submissions
24421 points
of Total Score
Thursday, 01 January 1970 07:00 | Updated at 1 month ago
About Geekbench3 - Single Core
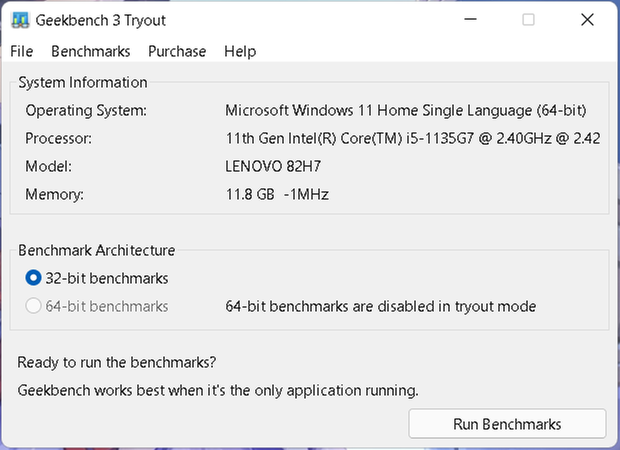
Geekbench 3 – Single Core is part of a popular benchmark testing suite created by Primate Labs that focuses on measuring the single-core performance of a processor. This test is very important because many applications and everyday tasks, including games, browsers, and other lightweight applications, still rely heavily on the speed and efficiency of a single CPU core in completing instructions.
In Single Core mode, Geekbench 3 runs a series of workloads that include data compression, encryption, physics simulation, image processing, and data manipulation, but only uses one core of the tested processor. The results provide an accurate picture of the CPU core's ability to handle general workloads not designed for multi-threading. This is particularly useful for evaluating processor performance in everyday usage scenarios.
Geekbench 3 Single Core scores are an important indicator for comparing processor architecture efficiency, operating frequency, and instructions per clock (IPC) capabilities between different CPU models, whether from the same generation or different ones. A high score indicates that the CPU can complete important tasks faster and more responsively even without utilizing multiple cores.
The advantage of Geekbench 3 lies in its cross-platform approach. This benchmark can be run on Windows, macOS, Linux, and mobile devices such as Android and iOS, allowing users to compare performance across devices consistently. This makes Geekbench 3 one of the most flexible and reliable benchmarking tools for measuring modern computing performance.
With a focus on Single Core Performance, Geekbench 3 provides valuable insights for users who rely on optimal performance in lightweight applications or scenarios where response speed is a top priority.
Benchmark Geekbench3 - Single Core Chart Ranking
The following graph displays the hardware performance ranking based on benchmark results using Geekbench3 - Single Core. The data is organized from highest to lowest score for easy visual comparison between devices. You can hover over each bar to view the score details and associated hardware name.
Benchmark Geekbench3 - Single Core Table Ranking
The following table presents hardware rankings based on benchmark results using Geekbench3 - Single Core. The table format provides detailed views such as device name, score, number of submissions, as well as links to test results. It's perfect for those who want to see detailed data and easily search or filter.
| No. | Hardware | Submissions from Geekbench3 - Single Core |
|---|---|---|
| 1 | Intel Core i5 1335U | 6182 points |
| 2 | Intel Core i5 1135G7 | 4933 points |
| 3 | Intel Core i5 6300U | 2561 points |
| 4 | Qualcomm SM6225 Snapdragon 680 4G | 2027 points |
| 5 | Intel Core i3 2330M | 1718 points |
| 6 | Intel Core 2 Duo E7500 | 1558 points |
| 7 | Intel Core i7 720QM | 1078 points |
| 8 | MediaTek MT6762 Helio P22 | 899 points |
| 9 | MediaTek MT6765 Helio P35 | 833 marks |
| 10 | AMD A6-3400M | 803 points |
| 11 | Amlogic S905X-BV | 652 points |
| 12 | MediaTek MT6750 | 602 marks |
| 13 | AMD E1-1200 | 575 points |
