Loading, please wait...

HWPure Header Banner


Hardware Image

AMD E1-1200

CPUID : AMD E1-1200 APU with Radeon(TM) HD Graphics
Architecture : x86
Codename : Zacate
L3 Cache : -
Clock : 1.4GHz
Core/Thread : 2/2
TDP : 18W
Technology : 40nm
Socket : FT1 BGA 413-Ball
IGPU : AMD Radeon HD 7310

See more specification...

Wednesday, 26 December 2012 14:27 | Update at 1 month ago


2 Core
2 Thread
Mobile Segmen
40 nm Technology
1.4 GHz Base Clock
- Turbo Clock
x86 Architecture

Hardware Benchmark Record

This table displays the scores or sequential read & write speeds (for storage types) of various synthetic benchmark applications commonly used to test hardware performance. You can click on the score column to view the submissions page by ID. At that URL, you can browse the submitted results of each application, including viewing screenshots of the benchmark results. For screenshots of benchmark results, you can click the "View" button in the screenshot column.

In total, there are 53 submissions across 52 different benchmark applications, each testing the hardware from a unique angle. This variety allows you to draw a more comprehensive conclusion about the hardware's real-world performance.

No Benchmark Score HWBOT/Benchmark URL Facebook URL Screenshot
7-Zip 2599 MIPS https://hwbot.org/submission/4989949 https://www.facebook.com/hakimnu.id/posts/3276665879232719
AIDA64 GPGPU Benchmark - Single Precision FLOPS 10.79 GFLOPS

[ not available ]

https://bit.ly/3RauwX4
AnTuTu Benchmark (BETA) - CPU 17111 points

[ not available ]

https://bit.ly/3Qpsbpr
Cinebench - 2003 292 cb https://hwbot.org/submission/4941863 https://www.facebook.com/hakimnu.id/posts/3209727832593191
Cinebench - 2003 Single Core 159 CB

[ not available ]

https://bit.ly/3TrGKvf
Cinebench - R11.5 0.54 pts https://hwbot.org/submission/4986470 https://www.facebook.com/hakimnu.id/posts/3282137855352188
Cinebench - R11.5 with BenchMate 0.52 pts https://hwbot.org/submission/4989961 https://www.facebook.com/hakimnu.id/posts/3275946062638034
Cinebench - R11.5 Single Core 0.28 pts

[ not available ]

https://bit.ly/3CLcV2S
Cinebench - R15 EXTREME! Multi Core 11 cb

[ not available ]

https://bit.ly/3cyMF0Z
Cinebench - R15 EXTREME! Single Core 6 cb

[ not available ]

https://bit.ly/3cyMF0Z
Cinebench - R15 44 cb https://hwbot.org/submission/4986471 https://www.facebook.com/hakimnu.id/posts/3281351492097491
Cinebench - R15 with BenchMate 44 cb https://hwbot.org/submission/4990218 https://www.facebook.com/hakimnu.id/posts/3275946062638034
Cinebench - R15 Single Core 23 cb

[ not available ]

https://bit.ly/3CJOWkt
Cinebench - R20 with BenchMate 80 pts https://hwbot.org/submission/4990921 https://www.facebook.com/hakimnu.id/posts/3275946062638034
Cinebench - R20 79 pts https://hwbot.org/submission/4995117 https://www.facebook.com/hakimnu.id/posts/3280653338833973
Cinebench - R20 Single Core 43 pts

[ not available ]

https://bit.ly/3KwKyHF
Cinebench - R23 Multi Core with BenchMate 204 pts https://hwbot.org/submission/4996314 https://www.facebook.com/hakimnu.id/posts/3283500525215921
Cinebench - R23 Single Core with BenchMate 110 pts https://hwbot.org/submission/4996315 https://www.facebook.com/hakimnu.id/posts/3283500525215921
CPU-Z Benchmark - Multi Thread 108.4 points

[ not available ]

https://bit.ly/3rAwPXx
CPU-Z Benchmark - Single Thread 57.7 points

[ not available ]

https://bit.ly/3rAwPXx
CPU Frequency 3549.92 MHz https://hwbot.org/submission/4941858 https://www.facebook.com/hakimnu.id/posts/3240222036210437
Geekbench3 - Multi Core 1050 points https://hwbot.org/submission/4955488 https://www.facebook.com/hakimnu.id/posts/3249549851944322
Geekbench3 - Single Core 575 points https://hwbot.org/submission/4955487 https://www.facebook.com/hakimnu.id/posts/3249549851944322
Geekbench4 - Multi Core 1240 points https://hwbot.org/submission/4954438 https://www.facebook.com/hakimnu.id/posts/3248745882024719
Geekbench4 - Single Core 737 points https://hwbot.org/submission/4954435 https://www.facebook.com/hakimnu.id/posts/3248745882024719
Geekbench5 - Multi Core 255 points https://hwbot.org/submission/4941872 https://www.facebook.com/hakimnu.id/posts/3197322523833722
Geekbench5 - Single Core 132 points https://hwbot.org/submission/4941876 https://www.facebook.com/hakimnu.id/posts/3197322523833722
Geekbench6 - Multi Core 193 points https://hwbot.org/submission/5365603

[ not available ]

Geekbench6 - Single Core 107 points https://hwbot.org/submission/5365604

[ not available ]

GPUPI for CPU - 100M 11min, 20sec, 588ms https://hwbot.org/submission/4954146 https://www.facebook.com/hakimnu.id/posts/3243092849256689
GPUPI for CPU - 1B 2h, 35min, 28sec, 985ms https://hwbot.org/submission/4954885 https://www.facebook.com/hakimnu.id/posts/3243092849256689
GPUPI for CPU - 1B 2h, 57min, 9sec, 173ms https://hwbot.org/submission/5076723 https://bit.ly/3d1xRZ3
GPUPI for CPU v.3.3 - 100M 15min, 49sec, 435ms https://hwbot.org/submission/5076721 https://bit.ly/3d1xRZ3
HWBOT x265 - 1080P 0.638 FPS https://hwbot.org/submission/4977221 https://www.facebook.com/hakimnu.id/posts/3263844430514864
HWBOT x265 - 4K 0.155 FPS https://hwbot.org/submission/4977316 https://www.facebook.com/hakimnu.id/posts/3263844430514864
HyperPi - 1M 58sec, 1ms

[ not available ]

https://bit.ly/3pvBxoy
HyperPi - 32M 47min, 45sec, 47ms

[ not available ]

https://bit.ly/3pvBxoy
PassMark - PerformanceTest (CPU Mark) 473 marks https://www.passmark.com/baselines/V10/display.php?id=167215852689 http://bit.ly/3hTc0VO
PCMark 7 1092 marks https://hwbot.org/submission/4999586 https://bit.ly/3K7SgHX
PCMark Vantage 2151 marks https://hwbot.org/submission/4999587 https://www.facebook.com/hakimnu.id/posts/3288159278083379
PiFast 1min, 49sec, 900ms https://hwbot.org/submission/4955475 https://www.facebook.com/hakimnu.id/posts/3265977126968261
PiFast with BenchMate 1min, 50sec, 260ms https://hwbot.org/submission/4990523 https://www.facebook.com/hakimnu.id/posts/3277435952489045
SuperPi - 1M 55sec, 754ms https://hwbot.org/submission/4955478 https://www.facebook.com/hakimnu.id/posts/3250622965170344
SuperPi - 1M with BenchMate 55sec, 195ms https://hwbot.org/submission/4990512 https://www.facebook.com/hakimnu.id/posts/3276665879232719
SuperPi - 32M 45min, 28sec, 176ms https://hwbot.org/submission/4955480 https://www.facebook.com/hakimnu.id/posts/3250622965170344
SuperPi - 32M with BenchMate 45min, 5sec, 892ms https://hwbot.org/submission/4990511 https://www.facebook.com/hakimnu.id/posts/3276665879232719
WinRAR - Multi Thread 720 KB/s

[ not available ]

https://bit.ly/3JssQpY
WinRAR - Single Thread 402 KB/s

[ not available ]

https://bit.ly/3JssQpY
wPrime - 32M 1min, 8sec, 78ms https://hwbot.org/submission/4948492 https://www.facebook.com/hakimnu.id/posts/3232676343631673
wPrime - 32M with BenchMate 1min, 8sec, 78ms https://hwbot.org/submission/4990531 https://www.facebook.com/hakimnu.id/posts/3277435952489045
wPrime - 1024M 36min, 6sec, 64ms https://hwbot.org/submission/4948495 https://bit.ly/3AbrdqK
wPrime - 1024M with BenchMate 35min, 29sec, 208ms https://hwbot.org/submission/4990618 https://www.facebook.com/hakimnu.id/posts/3277435952489045
y-cruncher - Pi-25m 1min, 10sec, 49ms https://hwbot.org/submission/4962093 https://www.facebook.com/hakimnu.id/posts/3265977126968261

Media Gallery

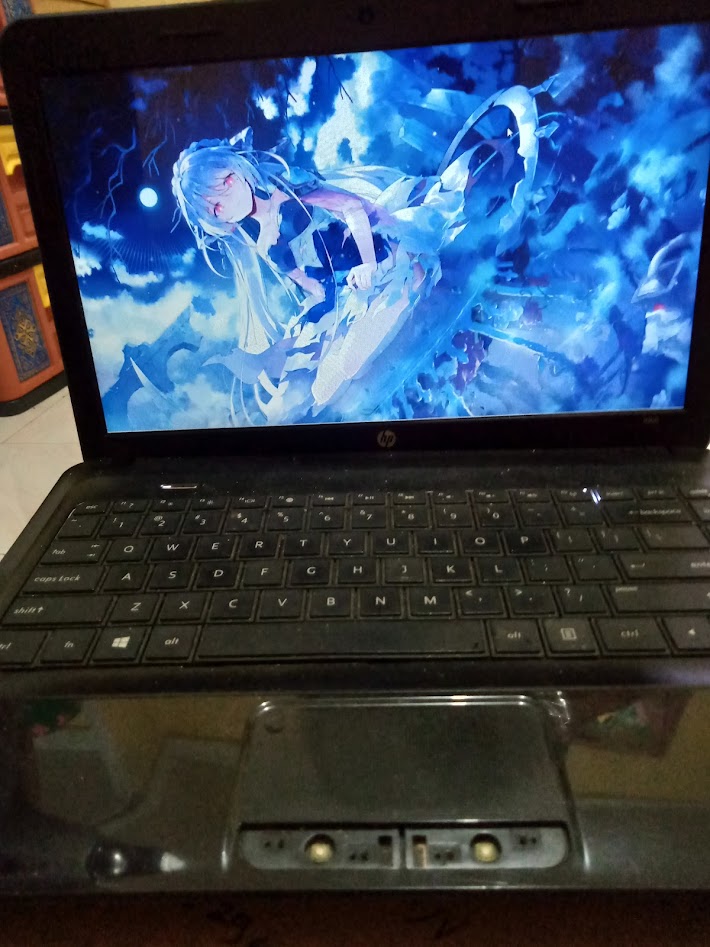
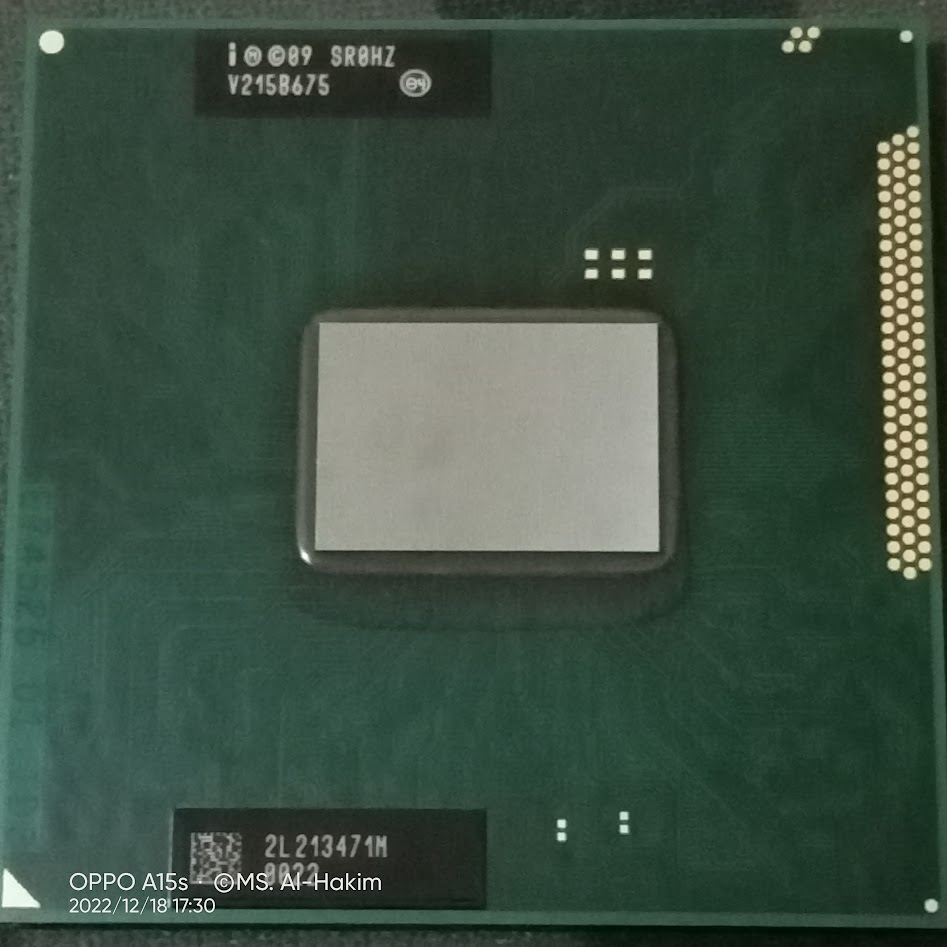
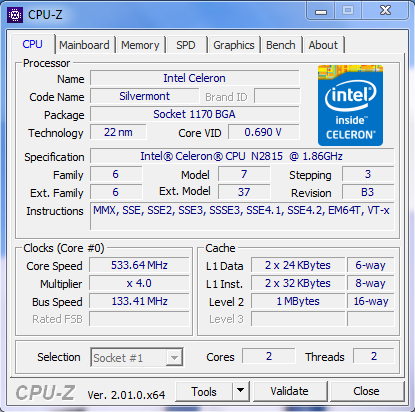
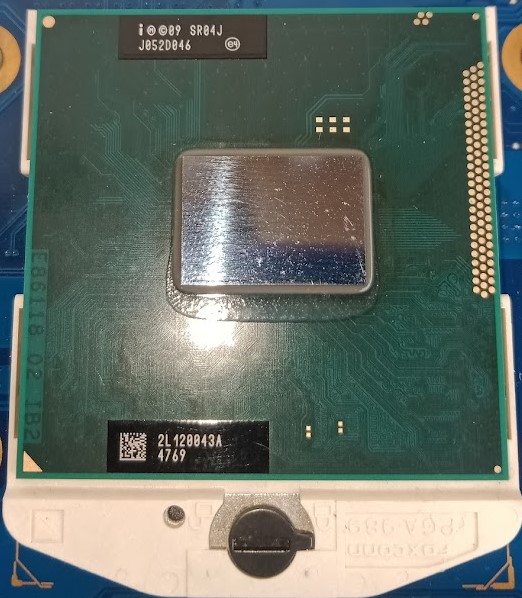
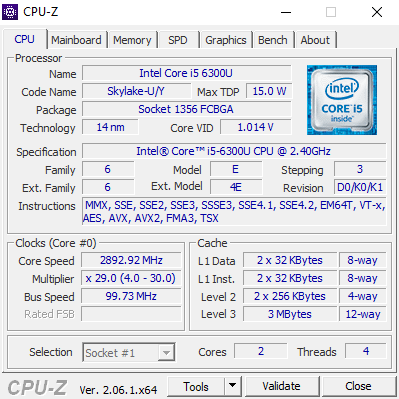
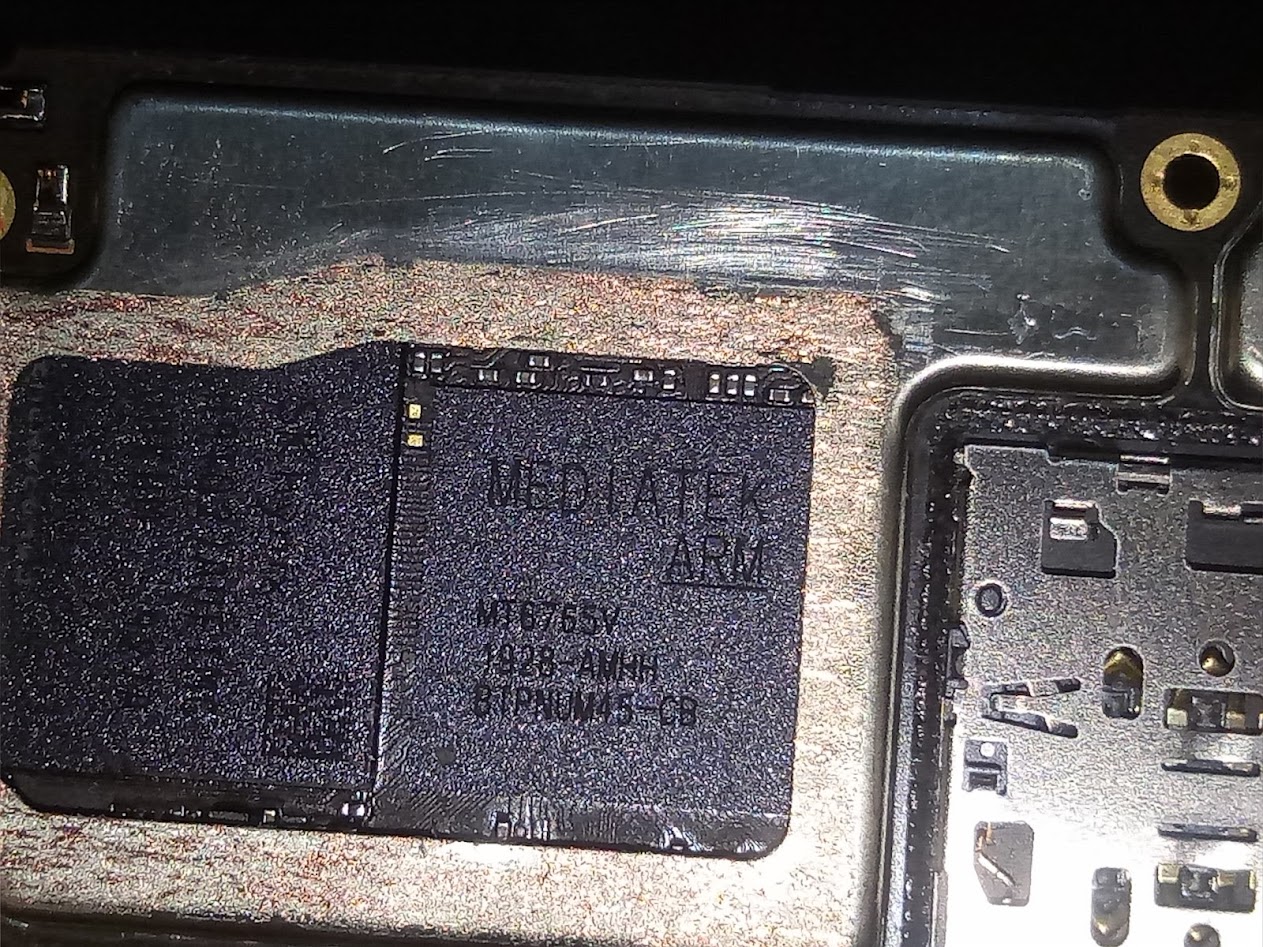
A collection of photos of tested hardware. These images can help you identify the physical form, model, and variant of the hardware in question. These photos are from our own documentation, and if they are not available we may not be able to document them.
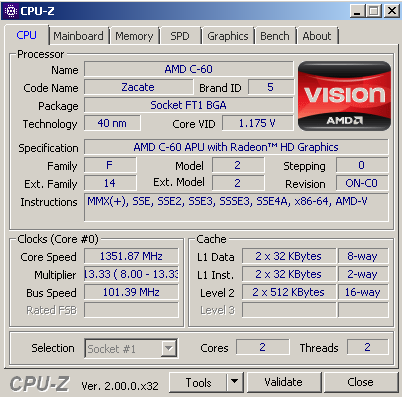
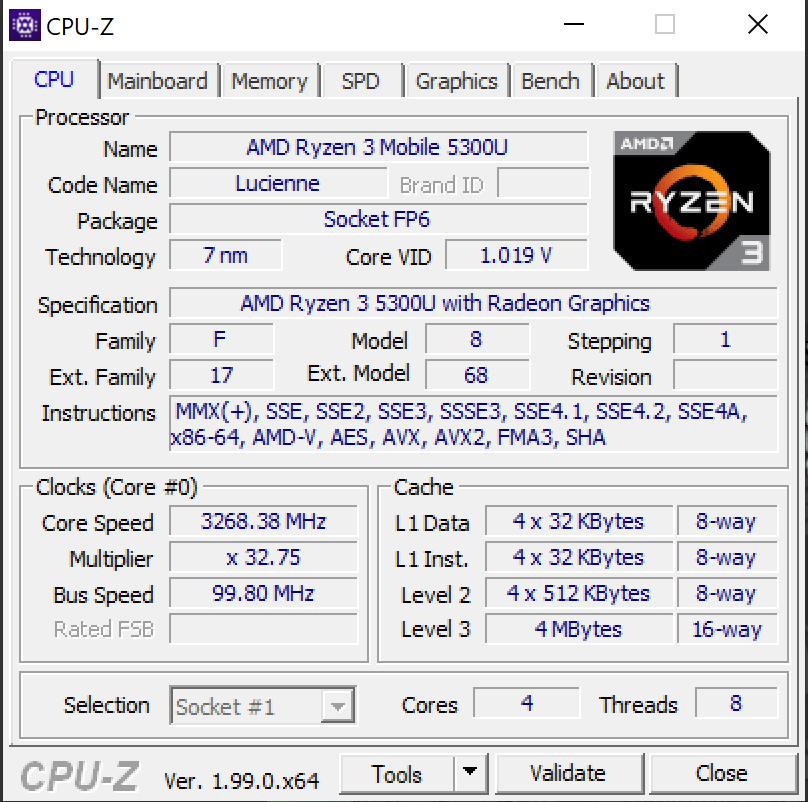

Nearby Competitors

Shows two other devices with slightly higher scores and two others with slightly lower scores on the same benchmarks. Useful to see how competitive these devices are.

7-Zip
Rank Hardware Score Performance Percentage
Higher Intel Core i7 720QM 10448 MIPS 402.0%
Higher Intel Core i5 6300U 10900 MIPS 419.4%
This Hardware AMD E1-1200 2599 MIPS 100%
Cinebench - 2003
Rank Hardware Score Performance Percentage
Higher AMD A6-3400M 765 cb 262.0%
Higher Intel Core 2 Duo E7500 986 cb 337.7%
This Hardware AMD E1-1200 292 cb 100%
Cinebench - R11.5
Rank Hardware Score Performance Percentage
Higher Intel Core 2 Duo E7500 1.61 pts 298.1%
Higher AMD A6-3400M 1.79 pts 331.5%
This Hardware AMD E1-1200 0.54 pts 100%
Cinebench - R11.5 with BenchMate
Rank Hardware Score Performance Percentage
Higher Intel Core i5 1135G7 9.45 pts 1,817.3%
Higher AMD Ryzen 3 5300U 10.38 pts 1,996.2%
This Hardware AMD E1-1200 0.52 pts 100%
Cinebench - R15
Rank Hardware Score Performance Percentage
Higher Intel Celeron B815 104 cb 236.4%
Higher AMD A6-3400M 153 cb 347.7%
This Hardware AMD E1-1200 44 cb 100%
Cinebench - R15 with BenchMate
Rank Hardware Score Performance Percentage
Higher Intel Core i5 1135G7 854 cb 1,940.9%
This Hardware AMD E1-1200 44 cb 100%
Cinebench - R20
Rank Hardware Score Performance Percentage
Higher Intel Celeron B815 207 pts 262.0%
Higher AMD A6-3400M 291 pts 368.4%
This Hardware AMD E1-1200 79 pts 100%
Cinebench - R20 with BenchMate
Rank Hardware Score Performance Percentage
Higher Intel Core i5 1135G7 1995 pts 2,493.8%
This Hardware AMD E1-1200 80 pts 100%
Cinebench - R23 Multi Core with BenchMate
Rank Hardware Score Performance Percentage
Higher Intel Core i7 720QM 1024 pts 502.0%
Higher Intel Core i5 6300U 1477 pts 724.0%
This Hardware AMD E1-1200 204 pts 100%
Cinebench - R23 Single Core with BenchMate
Rank Hardware Score Performance Percentage
Higher Intel Core i7 720QM 301 pts 273.6%
Higher Intel Core i5 6300U 777 pts 706.4%
This Hardware AMD E1-1200 110 pts 100%
CPU Frequency
Rank Hardware Score Performance Percentage
Higher Intel Core i5 1135G7 3795.05 MHz 106.9%
This Hardware AMD E1-1200 3549.92 MHz 100%
Geekbench3 - Multi Core
Rank Hardware Score Performance Percentage
Higher Amlogic S905X-BV 1926 points 183.4%
Higher MediaTek MT6750 1999 marks 190.4%
This Hardware AMD E1-1200 1050 points 100%
Geekbench3 - Single Core
Rank Hardware Score Performance Percentage
Higher MediaTek MT6750 602 marks 104.7%
Higher Amlogic S905X-BV 652 points 113.4%
This Hardware AMD E1-1200 575 points 100%
Geekbench4 - Multi Core
Rank Hardware Score Performance Percentage
Higher Amlogic S905X-BV 1791 points 144.4%
Higher MediaTek MT6750 2594 marks 209.2%
This Hardware AMD E1-1200 1240 points 100%
Geekbench4 - Single Core
Rank Hardware Score Performance Percentage
Higher MediaTek MT6762 Helio P22 827 points 112.2%
Higher MediaTek MT6765 Helio P35 886 marks 120.2%
This Hardware AMD E1-1200 737 points 100%
Lower MediaTek MT6750 665 marks 90.2%
Lower Amlogic S905X-BV 634 points 86.0%
Geekbench5 - Multi Core
Rank Hardware Score Performance Percentage
Higher MediaTek MT6762 Helio P22 609 points 238.8%
Higher AMD A6-3400M 746 points 292.5%
This Hardware AMD E1-1200 255 points 100%
Geekbench5 - Single Core
Rank Hardware Score Performance Percentage
Higher MediaTek MT6765 Helio P35 146 marks 110.6%
Higher MediaTek MT6762 Helio P22 154 points 116.7%
This Hardware AMD E1-1200 132 points 100%
GPUPI for CPU - 100M
Rank Hardware Score Performance Percentage
Higher Intel Core i5 1135G7 26sec, 772ms 3.9%
Higher Intel Core i5 6300U 1min, 544ms 8.9%
This Hardware AMD E1-1200 11min, 20sec, 588ms 100%
GPUPI for CPU - 1B
Rank Hardware Score Performance Percentage
Higher Intel Core i5 1135G7 5min, 49sec, 840ms 3.8%
Higher Intel Core i7 720QM 21min, 33sec, 52ms 13.9%
This Hardware AMD E1-1200 2h, 35min, 28sec, 985ms 100%
HWBOT x265 - 1080P
Rank Hardware Score Performance Percentage
Higher Intel Core i7 720QM 4.569 FPS 716.1%
Higher Intel Core i5 6300U 9.555 FPS 1,497.6%
This Hardware AMD E1-1200 0.638 FPS 100%
HWBOT x265 - 4K
Rank Hardware Score Performance Percentage
Higher Intel Core i5 6300U 2.148 FPS 1,385.8%
Higher Intel Core i5 1135G7 6.696 FPS 4,320.0%
This Hardware AMD E1-1200 0.155 FPS 100%
PCMark 7
Rank Hardware Score Performance Percentage
Higher Intel Core i7 720QM 1630 marks 149.3%
Higher Intel Core i5 6300U 5020 marks 459.7%
This Hardware AMD E1-1200 1092 marks 100%
PCMark Vantage
Rank Hardware Score Performance Percentage
This Hardware AMD E1-1200 2151 marks 100%
PiFast
Rank Hardware Score Performance Percentage
Higher Intel Core i7 11700 12sec, 510ms 11.4%
Higher Intel Core i5 1335U 13sec, 990ms 12.7%
This Hardware AMD E1-1200 1min, 49sec, 900ms 100%
Lower AMD C-60 2min, 14sec, 820ms 122.7%
PiFast with BenchMate
Rank Hardware Score Performance Percentage
Higher Intel Core i5 1135G7 16sec, 120ms 14.6%
Higher AMD Ryzen 3 5300U 20sec, 820ms 18.9%
This Hardware AMD E1-1200 1min, 50sec, 260ms 100%
SuperPi - 1M
Rank Hardware Score Performance Percentage
Higher Intel Core i7 11700 6sec, 921ms 12.4%
Higher Intel Core i5 1335U 7sec, 92ms 12.7%
This Hardware AMD E1-1200 55sec, 754ms 100%
Lower AMD C-60 1min, 139ms 107.9%
SuperPi - 1M with BenchMate
Rank Hardware Score Performance Percentage
Higher Intel Core i5 1135G7 7sec, 960ms 14.4%
Higher AMD Ryzen 3 5300U 10sec, 633ms 19.3%
This Hardware AMD E1-1200 55sec, 195ms 100%
SuperPi - 32M
Rank Hardware Score Performance Percentage
Higher Intel Core i5 1335U 6min, 38sec, 548ms 14.6%
Higher Intel Core i5 1135G7 7min, 8sec, 285ms 15.7%
This Hardware AMD E1-1200 45min, 28sec, 176ms 100%
Lower AMD C-60 52min, 10sec, 800ms 114.8%
SuperPi - 32M with BenchMate
Rank Hardware Score Performance Percentage
Higher Intel Core i5 1135G7 6min, 52sec, 446ms 15.2%
Higher Intel Core i7 720QM 22min, 4sec, 723ms 49.0%
This Hardware AMD E1-1200 45min, 5sec, 892ms 100%
wPrime - 1024M
Rank Hardware Score Performance Percentage
Higher Intel Core i5 1335U 3min, 3sec, 230ms 8.5%
Higher Intel Core i5 1135G7 3min, 18sec, 987ms 9.2%
This Hardware AMD E1-1200 36min, 6sec, 64ms 100%
wPrime - 1024M with BenchMate
Rank Hardware Score Performance Percentage
Higher AMD Ryzen 3 5300U 2min, 44sec, 977ms 7.7%
Higher Intel Core i5 1135G7 3min, 3sec, 767ms 8.6%
This Hardware AMD E1-1200 35min, 29sec, 208ms 100%
wPrime - 32M
Rank Hardware Score Performance Percentage
Higher Intel Core i5 1335U 3sec, 985ms 5.9%
Higher Intel Core i5 1135G7 6sec, 334ms 9.3%
This Hardware AMD E1-1200 1min, 8sec, 78ms 100%
wPrime - 32M with BenchMate
Rank Hardware Score Performance Percentage
Higher AMD Ryzen 3 5300U 5sec, 366ms 7.9%
Higher Intel Core i5 1135G7 5sec, 793ms 8.5%
This Hardware AMD E1-1200 1min, 8sec, 78ms 100%
y-cruncher - Pi-25m
Rank Hardware Score Performance Percentage
Higher Intel Core i5 1335U 1sec, 61ms 1.5%
Higher Intel Core i5 1135G7 1sec, 343ms 1.9%
This Hardware AMD E1-1200 1min, 10sec, 49ms 100%
HyperPi - 1M
Rank Hardware Score Performance Percentage
Higher Intel Core i5 1135G7 12sec, 87ms 20.8%
This Hardware AMD E1-1200 58sec, 1ms 100%
HyperPi - 32M
Rank Hardware Score Performance Percentage
Higher Intel Core i5 1135G7 28sec, 871ms 1.0%
This Hardware AMD E1-1200 47min, 45sec, 47ms 100%
Cinebench - 2003 Single Core
Rank Hardware Score Performance Percentage
Higher Intel Core i5 1135G7 1446 cb 909.4%
This Hardware AMD E1-1200 159 CB 100%
Cinebench - R11.5 Single Core
Rank Hardware Score Performance Percentage
Higher Intel Core i7 720QM 0.60 pts 214.3%
Higher Intel Core i5 1135G7 2.19 pts 782.1%
This Hardware AMD E1-1200 0.28 pts 100%
Cinebench - R15 Single Core
Rank Hardware Score Performance Percentage
Higher Intel Core i7 720QM 57 cb 247.8%
Higher AMD Ryzen 3 5300U 163 cb 708.7%
This Hardware AMD E1-1200 23 cb 100%
Cinebench - R20 Single Core
Rank Hardware Score Performance Percentage
Higher Intel Core i7 720QM 118 pts 274.4%
Higher Intel Core i5 1135G7 507 pts 1,179.1%
This Hardware AMD E1-1200 43 pts 100%
Cinebench - R15 EXTREME! Multi Core
Rank Hardware Score Performance Percentage
Higher Intel Core i5 1135G7 211 cb 1,918.2%
This Hardware AMD E1-1200 11 cb 100%
Cinebench - R15 EXTREME! Single Core
Rank Hardware Score Performance Percentage
Higher Intel Core i5 1135G7 52 cb 866.7%
This Hardware AMD E1-1200 6 cb 100%
AnTuTu Benchmark (BETA) - CPU
Rank Hardware Score Performance Percentage
Higher Intel Core i5 1135G7 298825 points 1,746.4%
This Hardware AMD E1-1200 17111 points 100%
GPUPI for CPU v.3.3 - 100M
Rank Hardware Score Performance Percentage
Higher Intel Core i5 1135G7 15sec, 271ms 1.6%
Higher Intel Core i5 6300U 1min, 2sec, 869ms 6.6%
This Hardware AMD E1-1200 15min, 49sec, 435ms 100%
GPUPI for CPU - 1B
Rank Hardware Score Performance Percentage
Higher Intel Core i5 1135G7 5min, 49sec, 840ms 3.3%
Higher Intel Core i7 720QM 21min, 33sec, 52ms 12.2%
This Hardware AMD E1-1200 2h, 57min, 9sec, 173ms 100%
CPU-Z Benchmark - Single Thread
Rank Hardware Score Performance Percentage
Higher Intel Core 2 Duo E7500 113.2 points 196.2%
Higher Intel Core i5 6300U 289.8 points 502.3%
This Hardware AMD E1-1200 57.7 points 100%
CPU-Z Benchmark - Multi Thread
Rank Hardware Score Performance Percentage
Higher Intel Core 2 Duo E7500 225.2 points 207.7%
Higher Intel Core i5 6300U 817.6 points 754.2%
This Hardware AMD E1-1200 108.4 points 100%
PassMark - PerformanceTest (CPU Mark)
Rank Hardware Score Performance Percentage
Higher Amlogic S905X-BV 579 points 122.4%
Higher MediaTek MT6762 Helio P22 3258 marks 688.8%
This Hardware AMD E1-1200 473 marks 100%
WinRAR - Single Thread
Rank Hardware Score Performance Percentage
Higher Intel Core i5 6300U 1075 KB/s 267.4%
Higher Intel Core i5 1135G7 1800 KB/s 447.8%
This Hardware AMD E1-1200 402 KB/s 100%
WinRAR - Multi Thread
Rank Hardware Score Performance Percentage
Higher Intel Core i5 6300U 3001 KB/s 416.8%
Higher Intel Core i5 1135G7 8781 KB/s 1,219.6%
This Hardware AMD E1-1200 720 KB/s 100%
AIDA64 GPGPU Benchmark - Single Precision FLOPS
Rank Hardware Score Performance Percentage
Higher Intel Core i5 1135G7 484.7 GFLOPS 4,492.1%
Higher AMD Ryzen 3 5300U 497.6 GFLOPS 4,611.7%
This Hardware AMD E1-1200 10.79 GFLOPS 100%
Geekbench6 - Multi Core
Rank Hardware Score Performance Percentage
Higher MediaTek MT6765 Helio P35 793 marks 410.9%
Higher Qualcomm SM6225 Snapdragon 680 4G 1424 points 737.8%
This Hardware AMD E1-1200 193 points 100%
Geekbench6 - Single Core
Rank Hardware Score Performance Percentage
Higher MediaTek MT6765 Helio P35 179 marks 167.3%
Higher Qualcomm SM6225 Snapdragon 680 4G 415 points 387.9%
This Hardware AMD E1-1200 107 points 100%

About E1-1200

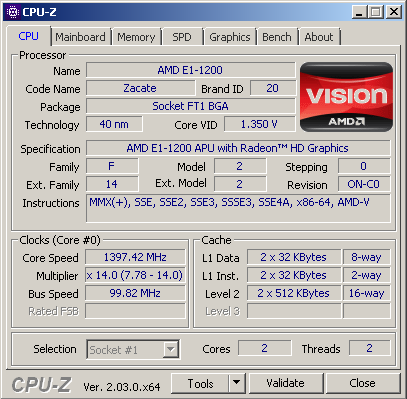
Released in 2012 as part of the Brazos 2.0 family, the AMD E1-1200 is a power-efficient processor aimed at entry-level laptops. It has a 2 core and 2 thread configuration with a fixed clock speed of 1.4 GHz, with no support for Turbo Core technology. Built with a 40nm fabrication process, the E1-1200 has a TDP value of 18 watts-efficient enough for portable devices that emphasize low power consumption and longer battery life. Despite its limited performance, the E1-1200 was a popular choice in its day thanks to its affordable price and ability to handle light computing needs.

One of the main advantages of the AMD E1-1200 is the integrated Radeon HD 7310 GPU, which offers better graphics performance than Intel's entry-level graphics solutions at the time. This GPU has the ability to play HD resolution videos smoothly, as well as run light games such as Counter Strike 1.6, Plants vs Zombies, or other casual games with minimum graphics settings. That said, this combination of CPU and GPU is not intended for heavy-duty work such as video editing, 3D rendering, or modern gaming. Overall performance is more optimal when used for tasks such as browsing, streaming videos, accessing social media, typing documents, as well as basic office applications.

However, it should be noted that the AMD E1-1200 is less suitable for heavy multitasking, especially in modern operating systems like Windows 10. With a low clock speed and no Boost feature, users may experience lag or limitations when opening multiple applications at once. In tests using the HP 1000 1b05au laptop, this processor was paired with 4GB DDR3 single channel RAM (2 DIMM slots) and tested on Windows 7, Windows 8, and Windows 10 operating systems. The results show that the most optimal performance is achieved on Windows 7 or Windows 8, while in Windows 10 the system tends to be slow although it can still be used for basic needs. As such, the AMD E1-1200 can still be relied upon as a power-efficient and inexpensive solution for users with very light computing needs.

Hardware Detail:

Device: HP 1000 1b05au
RAM: 4GB DDR3 Single Channel 2 DIMM
OS: Windows 7, Windows 8,  Windows 10 


Need Compare to Other Hardware?

You can compare AMD E1-1200 hardware with related hardware below


Related Hardware

Explore other Processors hardware that are related to AMD E1-1200