Loading, please wait...

HWPure Header Banner


Hardware Image

Intel Core i3 2330M

CPUID : Intel(R) Core(TM) i3-2330M CPU @ 2.20GHz
Architecture : x86
Codename : Sandy Bridge
L3 Cache : 3MB
Clock : 2.20GHz
Core/Thread : 2/4
TDP : 35W
Technology : 32nm
Socket : PPGA988
IGPU : Intel HD Graphics 3000 Mobile

See more specification...

Friday, 05 February 2021 15:48 | Update at 1 month ago


2 Core
4 Thread
Mobile Segmen
32 nm Technology
2.2 GHz Base Clock
- Turbo Clock
x86 Architecture

Hardware Benchmark Record

This table displays the scores or sequential read & write speeds (for storage types) of various synthetic benchmark applications commonly used to test hardware performance. You can click on the score column to view the submissions page by ID. At that URL, you can browse the submitted results of each application, including viewing screenshots of the benchmark results. For screenshots of benchmark results, you can click the "View" button in the screenshot column.

In total, there are 15 submissions across 15 different benchmark applications, each testing the hardware from a unique angle. This variety allows you to draw a more comprehensive conclusion about the hardware's real-world performance.

No Benchmark Score HWBOT/Benchmark URL Facebook URL Screenshot
Cinebench - 2003 1067 cb https://hwbot.org/submission/5130929 -
Cinebench - R11.5 1.95 pts https://hwbot.org/submission/5130933 -
Cinebench - R15 163 cb https://hwbot.org/submission/5138291 -
Cinebench - R20 413 pts https://hwbot.org/submission/5138293 -
Geekbench3 - Multi Core 3652 points https://hwbot.org/submission/5138306 -
Geekbench3 - Single Core 1718 points https://hwbot.org/submission/5138307 -
Geekbench4 - Multi Core 4322 points https://hwbot.org/submission/5138302 -
Geekbench4 - Single Core 2239 points https://hwbot.org/submission/5138304 -
Geekbench5 - Multi Core 936 points https://hwbot.org/submission/5138297 -
Geekbench5 - Single Core 410 points https://hwbot.org/submission/5138298 -
PiFast 34sec, 710ms https://hwbot.org/submission/5130940 -
SuperPi - 1M 18sec, 143ms https://hwbot.org/submission/5130937 -
SuperPi - 32M 16min, 54sec, 925ms https://hwbot.org/submission/5138294 -
wPrime - 32M 23sec, 73ms https://hwbot.org/submission/5130938 -
wPrime - 1024M 11min, 51sec, 960ms https://hwbot.org/submission/5138296 -

Media Gallery

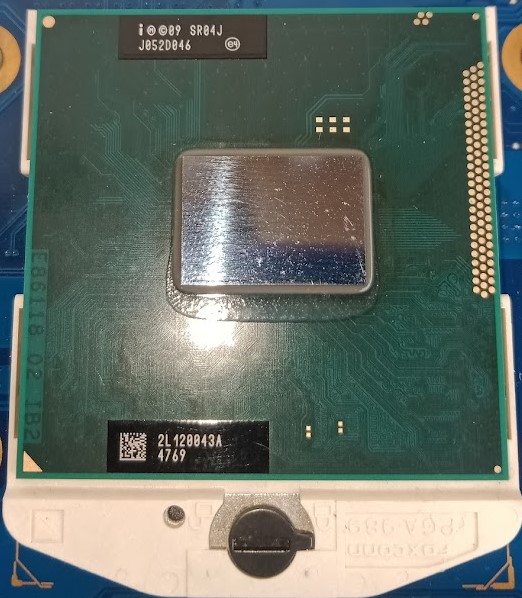
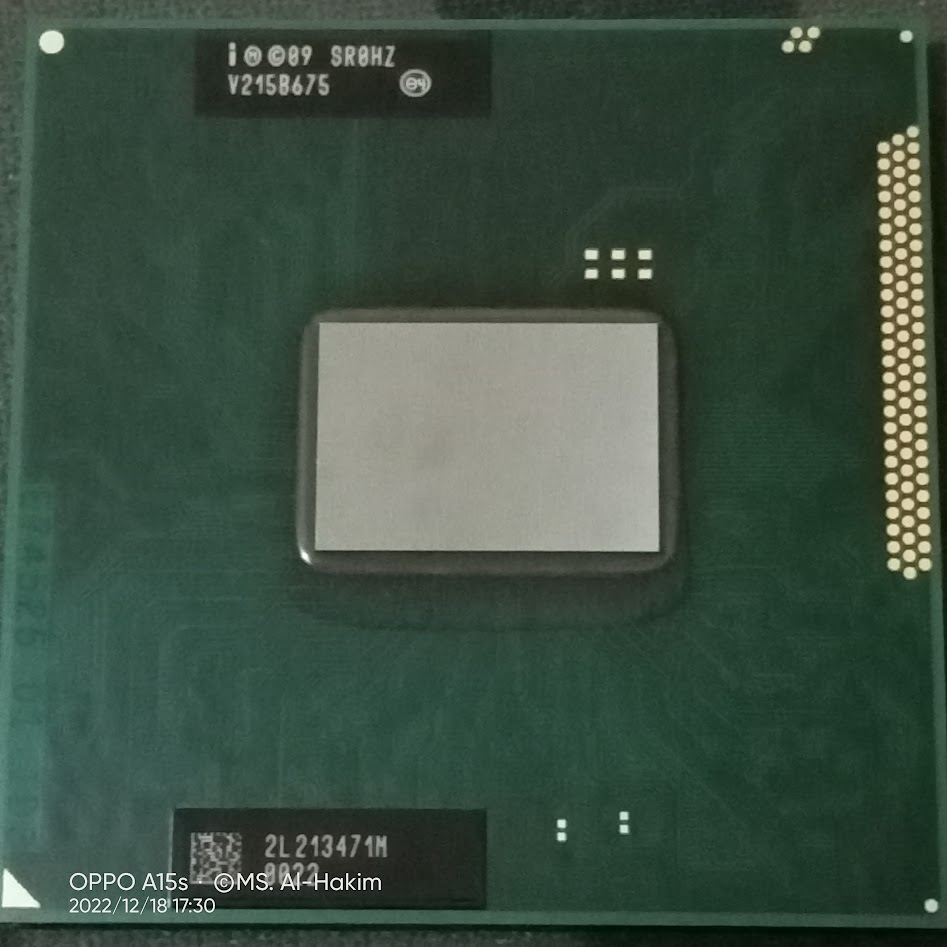
A collection of photos of tested hardware. These images can help you identify the physical form, model, and variant of the hardware in question. These photos are from our own documentation, and if they are not available we may not be able to document them.


Nearby Competitors

Shows two other devices with slightly higher scores and two others with slightly lower scores on the same benchmarks. Useful to see how competitive these devices are.

Cinebench - 2003
Rank Hardware Score Performance Percentage
Higher Intel Core i7 720QM 1211 cb 113.5%
Higher Intel Core i5 6300U 1601 cb 150.0%
This Hardware Intel Core i3 2330M 1067 cb 100%
Lower Intel Core 2 Duo E7500 986 cb 92.4%
Lower AMD A6-3400M 765 cb 71.7%
Cinebench - R11.5
Rank Hardware Score Performance Percentage
Higher Intel Core i7 720QM 2.71 pts 139.0%
Higher Intel Core i5 6300U 2.91 pts 149.2%
This Hardware Intel Core i3 2330M 1.95 pts 100%
Lower AMD A6-3400M 1.79 pts 91.8%
Lower Intel Core 2 Duo E7500 1.61 pts 82.6%
PiFast
Rank Hardware Score Performance Percentage
Higher Intel Core i7 11700 12sec, 510ms 36.0%
Higher Intel Core i5 1335U 13sec, 990ms 40.3%
This Hardware Intel Core i3 2330M 34sec, 710ms 100%
Lower AMD C-60 2min, 14sec, 820ms 388.4%
Lower AMD E1-1200 1min, 49sec, 900ms 316.6%
SuperPi - 1M
Rank Hardware Score Performance Percentage
Higher Intel Core i7 11700 6sec, 921ms 38.1%
Higher Intel Core i5 1335U 7sec, 92ms 39.1%
This Hardware Intel Core i3 2330M 18sec, 143ms 100%
Lower AMD C-60 1min, 139ms 331.5%
Lower AMD E1-1200 55sec, 754ms 307.3%
wPrime - 32M
Rank Hardware Score Performance Percentage
Higher Intel Core i5 1335U 3sec, 985ms 17.3%
Higher Intel Core i5 1135G7 6sec, 334ms 27.5%
This Hardware Intel Core i3 2330M 23sec, 73ms 100%
Lower AMD E1-1200 1min, 8sec, 78ms 295.1%
Lower Intel Celeron N2815 47sec, 267ms 204.9%
Cinebench - R15
Rank Hardware Score Performance Percentage
Higher Intel Core i7 720QM 220 cb 135.0%
Higher Intel Core i5 6300U 262 cb 160.7%
This Hardware Intel Core i3 2330M 163 cb 100%
Lower AMD A6-3400M 153 cb 93.9%
Lower Intel Celeron B815 104 cb 63.8%
Cinebench - R20
Rank Hardware Score Performance Percentage
Higher Intel Core i7 720QM 527 pts 127.6%
Higher Intel Core i5 6300U 656 pts 158.8%
This Hardware Intel Core i3 2330M 413 pts 100%
Lower AMD A6-3400M 291 pts 70.5%
Lower Intel Celeron B815 207 pts 50.1%
SuperPi - 32M
Rank Hardware Score Performance Percentage
Higher Intel Core i5 1335U 6min, 38sec, 548ms 39.3%
Higher Intel Core i5 1135G7 7min, 8sec, 285ms 42.2%
This Hardware Intel Core i3 2330M 16min, 54sec, 925ms 100%
Lower AMD C-60 52min, 10sec, 800ms 308.5%
Lower AMD E1-1200 45min, 28sec, 176ms 268.8%
wPrime - 1024M
Rank Hardware Score Performance Percentage
Higher Intel Core i5 1335U 3min, 3sec, 230ms 25.7%
Higher Intel Core i5 1135G7 3min, 18sec, 987ms 27.9%
This Hardware Intel Core i3 2330M 11min, 51sec, 960ms 100%
Lower AMD E1-1200 36min, 6sec, 64ms 304.2%
Lower AMD A6-3400M 13min, 40sec, 939ms 115.3%
Geekbench5 - Multi Core
Rank Hardware Score Performance Percentage
Higher Intel Core i5 6300U 1397 points 149.3%
Higher Qualcomm SM6225 Snapdragon 680 4G 1624 points 173.5%
This Hardware Intel Core i3 2330M 936 points 100%
Lower Intel Core i7 720QM 917 points 98.0%
Lower MediaTek MT6765 Helio P35 880 marks 94.0%
Geekbench5 - Single Core
Rank Hardware Score Performance Percentage
Higher Intel Core i5 6300U 711 points 173.4%
Higher Intel Core i5 1135G7 1403 points 342.2%
This Hardware Intel Core i3 2330M 410 points 100%
Lower Qualcomm SM6225 Snapdragon 680 4G 384 points 93.7%
Lower Intel Core i7 720QM 282 points 68.8%
Geekbench4 - Multi Core
Rank Hardware Score Performance Percentage
Higher Intel Core i7 720QM 4457 points 103.1%
Higher Intel Core i5 6300U 6112 points 141.4%
This Hardware Intel Core i3 2330M 4322 points 100%
Lower MediaTek MT6765 Helio P35 3763 marks 87.1%
Lower MediaTek MT6762 Helio P22 3263 points 75.5%
Geekbench4 - Single Core
Rank Hardware Score Performance Percentage
Higher Intel Core i5 6300U 3309 points 147.8%
Higher Intel Core i5 1135G7 6098 points 272.4%
This Hardware Intel Core i3 2330M 2239 points 100%
Lower Qualcomm SM6225 Snapdragon 680 4G 1831 points 81.8%
Lower Intel Core i7 720QM 1420 points 63.4%
Geekbench3 - Multi Core
Rank Hardware Score Performance Percentage
Higher MediaTek MT6765 Helio P35 3836 marks 105.0%
Higher MediaTek MT6762 Helio P22 4101 points 112.3%
This Hardware Intel Core i3 2330M 3652 points 100%
Lower Intel Core 2 Duo E7500 2862 points 78.4%
Lower AMD A6-3400M 2861 points 78.3%
Geekbench3 - Single Core
Rank Hardware Score Performance Percentage
Higher Qualcomm SM6225 Snapdragon 680 4G 2027 points 118.0%
Higher Intel Core i5 6300U 2561 points 149.1%
This Hardware Intel Core i3 2330M 1718 points 100%
Lower Intel Core 2 Duo E7500 1558 points 90.7%
Lower Intel Core i7 720QM 1078 points 62.7%

About i3-2330M

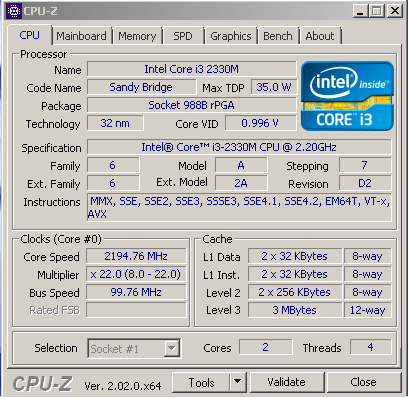
The Intel Core i3-2330M is a dual-core mobile processor launched in 2011 as part of Intel’s second-generation Sandy Bridge lineup. Designed for mid-range laptops, this processor features 2 cores and 4 threads thanks to Intel Hyper-Threading Technology, allowing it to handle light to moderate multitasking workloads efficiently. Operating at a fixed clock speed of 2.2 GHz and built on the 32nm process, the i3-2330M does not include Intel Turbo Boost, which limits its ability to dynamically increase performance under heavier loads, but it remains a solid choice for everyday use.

With a TDP of 35W, the i3-2330M balances power consumption and performance reasonably well for its era. It integrates Intel HD Graphics 3000, a GPU with a base clock of 650 MHz and a dynamic frequency up to 1.1 GHz. While not designed for modern gaming or demanding graphic applications, this integrated GPU handles HD video playback, basic 3D rendering, and older or lightweight games at low settings with relative ease. Users looking for casual computing and multimedia playback will find it sufficient.

In real-world usage, the Core i3-2330M performs well for standard computing tasks such as web browsing, streaming, office productivity (e.g., Word, Excel), and simple photo editing. Its Hyper-Threading capabilities give it a performance edge over older dual-core processors that lack thread duplication. However, the lack of Turbo Boost and a relatively low base frequency mean that it can struggle under CPU-intensive workloads like video rendering or large spreadsheet processing, especially when compared to more modern CPUs.

This specific configuration was tested on a SAMSUNG 300E4Z, a laptop originally shipped with an Intel Celeron B815 processor but later upgraded to the i3-2330M for better performance. With 4GB of DDR3 dual-channel memory and Windows 7 installed, the system runs smoothly for basic daily use, making the i3-2330M a practical upgrade option for budget-conscious users seeking improved performance without replacing their entire system.

Hardware Detail:

Device: SAMSUNG 300E4Z (This device originally used Celeron B815 which was upgraded to i3 2330M.)
RAM: 4GB DDR3 Dual Channel
OS: Windows 7


Need Compare to Other Hardware?

You can compare Intel Core i3 2330M hardware with related hardware below


Related Hardware

Explore other Processors hardware that are related to Intel Core i3 2330M