
CINEBENCH - R11.5
10
of Total Submissions
74.55 pts
of Total Score
Thursday, 01 January 1970 07:00 | Updated at 1 month ago
About Cinebench - R11.5
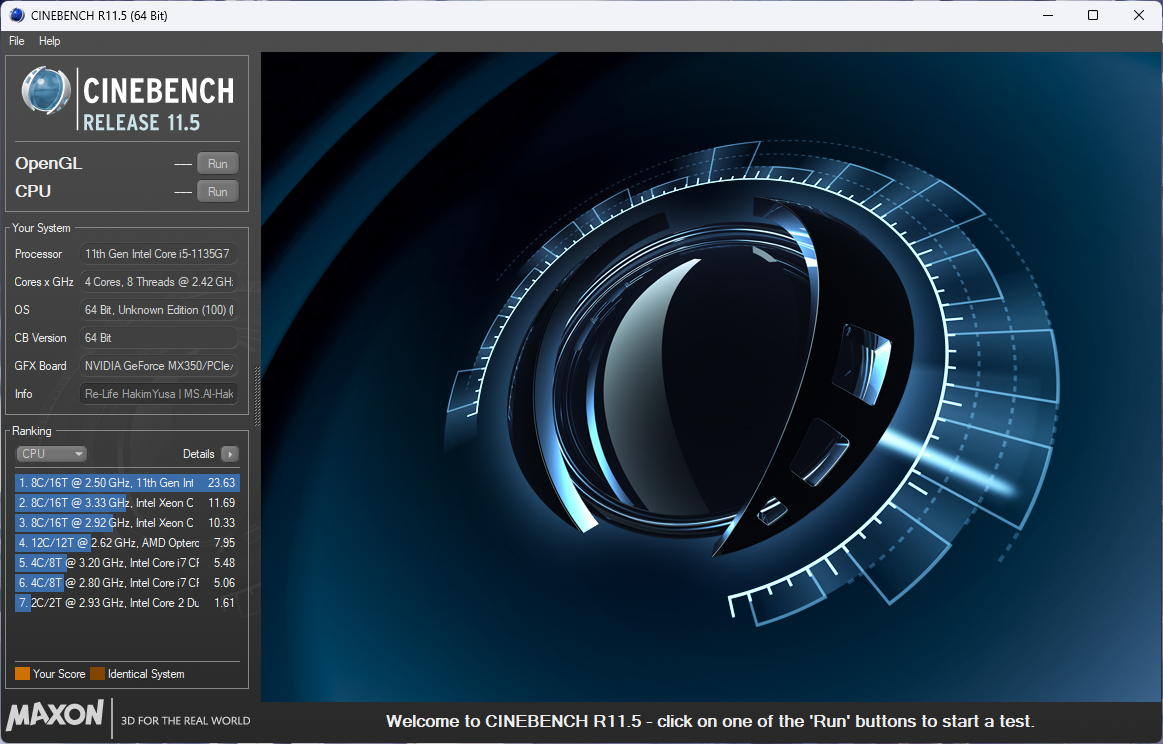
Cinebench R11.5 is one of MAXON's popular benchmarks designed to measure CPU performance in complex 3D rendering scenarios. The benchmark is based on the CINEMA 4D rendering engine and is widely used by tech enthusiasts, hardware reviewers, and professionals in the creative industry. Cinebench R11.5 simulates the rendering process of AixSponza's “No Keyframes” animation scene, which consists of thousands of 3D objects and various advanced lighting techniques and visual effects.
One of the key strengths of Cinebench R11.5 is its ability to use up to 64 processor threads in parallel, making it perfect for measuring the overall performance of multi-core CPUs. The test makes use of advanced algorithms such as sharp and blurry reflections, area lighting, realistic shadows, procedural shaders, and anti-aliasing, which represent real workloads in the 3D animation and visualization industry.
The scenes rendered in this benchmark include around 2,000 objects and over 300,000 polygons, making it very demanding for the test system. Test results are given in points (pts), where higher numbers indicate faster and more efficient CPU performance in completing rendering tasks. As such, Cinebench R11.5 is a very useful reference for assessing processor performance in creative and technical applications.
Despite the arrival of newer versions such as R15 and R23, Cinebench R11.5 is still relevant for users who want to make comparisons across processor generations. Many overclockers and users of legacy systems still rely on this version for stability and performance benchmarks due to its realistic yet not too heavy workloads for modern CPUs. With its ability to simulate real-world workflows, Cinebench R11.5 is a great test tool for anyone looking to evaluate their CPU performance in the context of professional rendering.
Benchmark Cinebench - R11.5 Chart Ranking
The following graph displays the hardware performance ranking based on benchmark results using Cinebench - R11.5. The data is organized from highest to lowest score for easy visual comparison between devices. You can hover over each bar to view the score details and associated hardware name.
Benchmark Cinebench - R11.5 Table Ranking
The following table presents hardware rankings based on benchmark results using Cinebench - R11.5. The table format provides detailed views such as device name, score, number of submissions, as well as links to test results. It's perfect for those who want to see detailed data and easily search or filter.
| No. | Hardware | Submissions from Cinebench - R11.5 |
|---|---|---|
| 1 | Intel Core i7 11700 | 23.63 pts |
| 2 | Intel Core i5 1335U | 19.45 pts |
| 3 | Intel Core i5 1135G7 | 10.37 pts |
| 4 | Intel Core i7 7700K | 9.59 pts |
| 5 | Intel Core i5 6300U | 2.91 pts |
| 6 | Intel Core i7 720QM | 2.71 pts |
| 7 | Intel Core i3 2330M | 1.95 pts |
| 8 | AMD A6-3400M | 1.79 pts |
| 9 | Intel Core 2 Duo E7500 | 1.61 pts |
| 10 | AMD E1-1200 | 0.54 pts |