

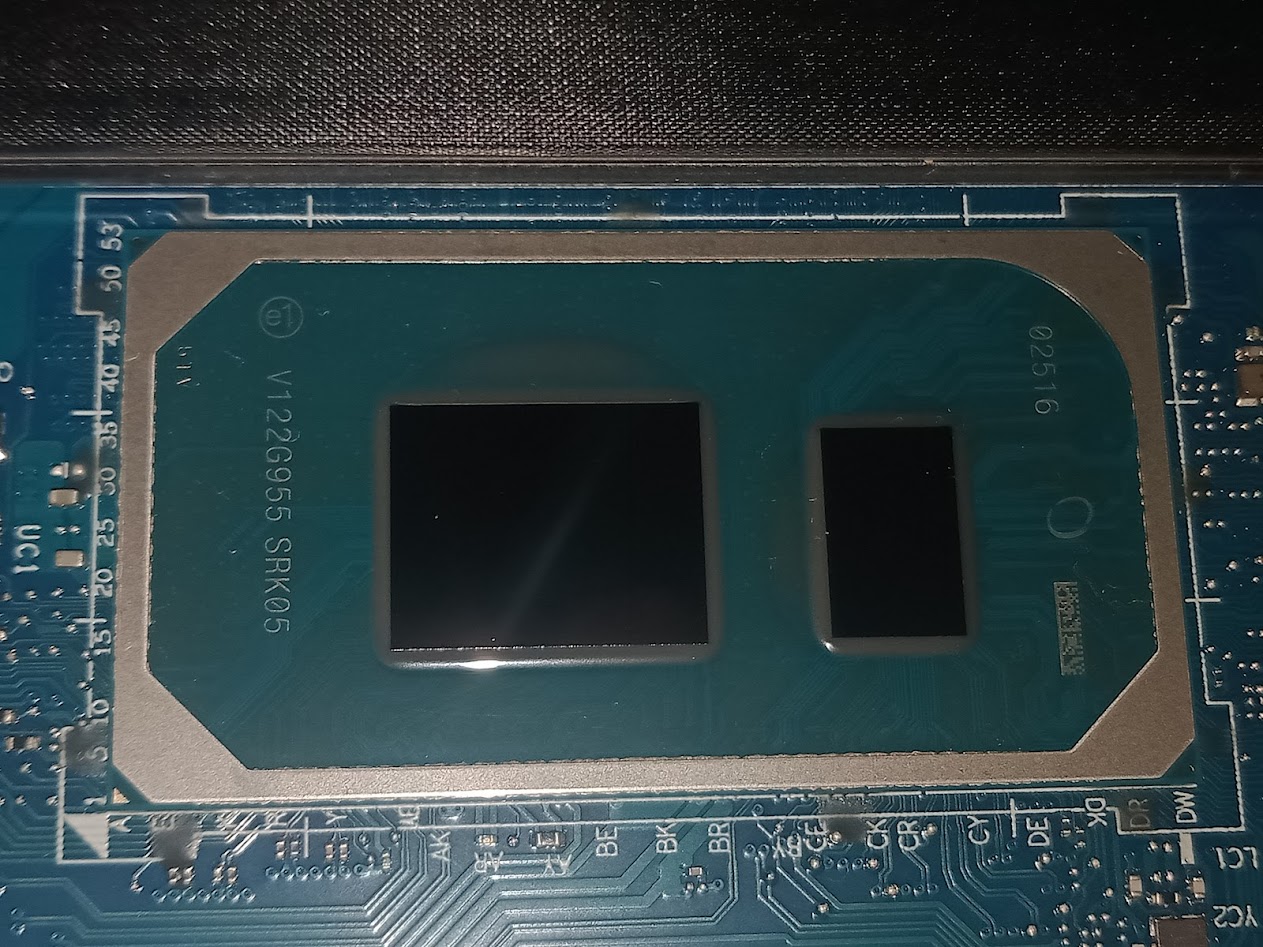
Intel Core i5 1335U
CPUID : 13th Gen Intel(R) Core(TM) i5-1335U
Architecture : x86
Codename : Raptor Lake
L3 Cache : 12 MB
Clock : 1.3GHz - 4.6GHz
Core/Thread : 10(2P + 8E)/12
TDP : 15W
Technology : 10nm
Socket : 1744 FCBGA
IGPU : Intel Iris Xe Graphics Mobile (80EUs, Raptor Lake)
See more specification...
Tuesday, 15 August 2023 13:16 | Update at 1 month ago
Hardware Benchmark Record
This table displays the scores or sequential read & write speeds (for storage types) of various synthetic benchmark applications commonly used to test hardware performance. You can click on the score column to view the submissions page by ID. At that URL, you can browse the submitted results of each application, including viewing screenshots of the benchmark results. For screenshots of benchmark results, you can click the "View" button in the screenshot column.
In total, there are 29 submissions across 29 different benchmark applications, each testing the hardware from a unique angle. This variety allows you to draw a more comprehensive conclusion about the hardware's real-world performance.
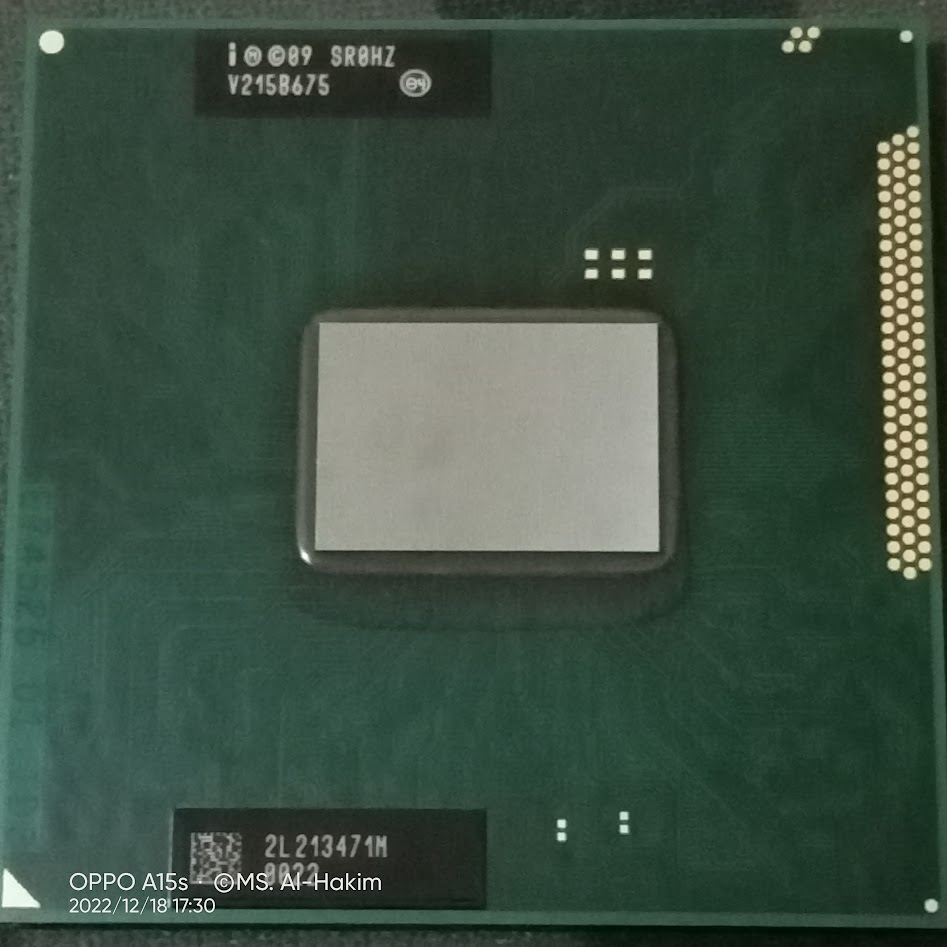
Media Gallery
A collection of photos of tested hardware. These images can help you identify the physical form, model, and variant of the hardware in question. These photos are from our own documentation, and if they are not available we may not be able to document them.

Nearby Competitors
Shows two other devices with slightly higher scores and two others with slightly lower scores on the same benchmarks. Useful to see how competitive these devices are.
7-Zip
| Rank | Hardware | Score | Performance Percentage |
|---|---|---|---|
| This Hardware | Intel Core i5 1335U | 52680 MIPS | 100% |
| Lower | AMD Ryzen 3 5300U | 33803 MIPS | 64.2% |
| Lower | Intel Core i5 1135G7 | 30697 MIPS | 58.3% |
Cinebench - R11.5
| Rank | Hardware | Score | Performance Percentage |
|---|---|---|---|
| Higher | Intel Core i7 11700 | 23.63 pts | 121.5% |
| This Hardware | Intel Core i5 1335U | 19.45 pts | 100% |
| Lower | Intel Core i5 1135G7 | 10.37 pts | 53.3% |
| Lower | Intel Core i7 7700K | 9.59 pts | 49.3% |
Cinebench - R15
| Rank | Hardware | Score | Performance Percentage |
|---|---|---|---|
| Higher | Intel Core i9 11900F | 2034 cb | 150.7% |
| Higher | Intel Core i7 11700 | 2153 cb | 159.5% |
| This Hardware | Intel Core i5 1335U | 1350 cb | 100% |
| Lower | Intel Core i5 1135G7 | 936 cb | 69.3% |
| Lower | Intel Core i7 7700K | 867 cb | 64.2% |
Cinebench - R20
| Rank | Hardware | Score | Performance Percentage |
|---|---|---|---|
| Higher | Intel Core i7 11700 | 4217 pts | 137.5% |
| This Hardware | Intel Core i5 1335U | 3066 pts | 100% |
| Lower | Intel Core i7 7700K | 2222 pts | 72.5% |
| Lower | Intel Core i5 1135G7 | 2195 pts | 71.6% |
Cinebench - R23 Multi Core with BenchMate
| Rank | Hardware | Score | Performance Percentage |
|---|---|---|---|
| This Hardware | Intel Core i5 1335U | 8031 pts | 100% |
| Lower | Intel Core i5 1135G7 | 5661 pts | 70.5% |
| Lower | Intel Core i5 6300U | 1477 pts | 18.4% |
Cinebench - R23 Single Core with BenchMate
| Rank | Hardware | Score | Performance Percentage |
|---|---|---|---|
| This Hardware | Intel Core i5 1335U | 1611 pts | 100% |
| Lower | Intel Core i5 1135G7 | 1334 pts | 82.8% |
| Lower | Intel Core i5 6300U | 777 pts | 48.2% |
PiFast
| Rank | Hardware | Score | Performance Percentage |
|---|---|---|---|
| Higher | Intel Core i7 11700 | 12sec, 510ms | 89.4% |
| This Hardware | Intel Core i5 1335U | 13sec, 990ms | 100% |
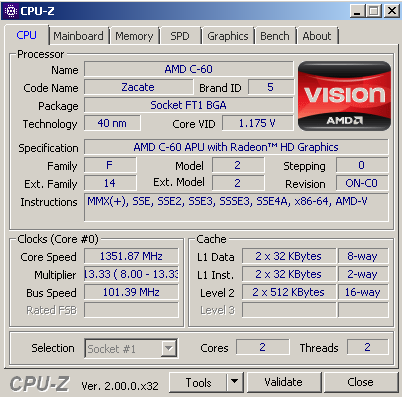
| Lower | AMD C-60 | 2min, 14sec, 820ms | 963.7% |
| Lower | AMD E1-1200 | 1min, 49sec, 900ms | 785.6% |
SuperPi - 1M
| Rank | Hardware | Score | Performance Percentage |
|---|---|---|---|
| Higher | Intel Core i7 11700 | 6sec, 921ms | 97.6% |
| This Hardware | Intel Core i5 1335U | 7sec, 92ms | 100% |
| Lower | AMD C-60 | 1min, 139ms | 848.0% |
| Lower | AMD E1-1200 | 55sec, 754ms | 786.2% |
SuperPi - 32M
| Rank | Hardware | Score | Performance Percentage |
|---|---|---|---|
| This Hardware | Intel Core i5 1335U | 6min, 38sec, 548ms | 100% |
| Lower | AMD C-60 | 52min, 10sec, 800ms | 785.6% |
| Lower | AMD E1-1200 | 45min, 28sec, 176ms | 684.5% |
wPrime - 32M
| Rank | Hardware | Score | Performance Percentage |
|---|---|---|---|
| This Hardware | Intel Core i5 1335U | 3sec, 985ms | 100% |
| Lower | AMD E1-1200 | 1min, 8sec, 78ms | 1,708.4% |
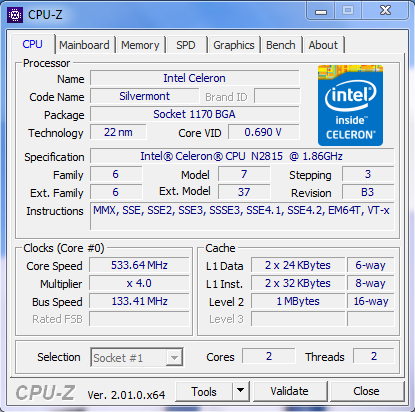
| Lower | Intel Celeron N2815 | 47sec, 267ms | 1,186.1% |
wPrime - 1024M
| Rank | Hardware | Score | Performance Percentage |
|---|---|---|---|
| This Hardware | Intel Core i5 1335U | 3min, 3sec, 230ms | 100% |
| Lower | AMD E1-1200 | 36min, 6sec, 64ms | 1,182.2% |
| Lower | AMD A6-3400M | 13min, 40sec, 939ms | 448.0% |
y-cruncher - Pi-25m
| Rank | Hardware | Score | Performance Percentage |
|---|---|---|---|
| This Hardware | Intel Core i5 1335U | 1sec, 61ms | 100% |
| Lower | AMD E1-1200 | 1min, 10sec, 49ms | 6,602.2% |
| Lower | AMD A6-3400M | 17sec, 682ms | 1,666.5% |
AIDA64 GPGPU Benchmark - Single Precision FLOPS
| Rank | Hardware | Score | Performance Percentage |
|---|---|---|---|
| This Hardware | Intel Core i5 1335U | 599.4 GFLOPS | 100% |
| Lower | Intel Core i7 7700K | 554.8 GFLOPS | 92.6% |
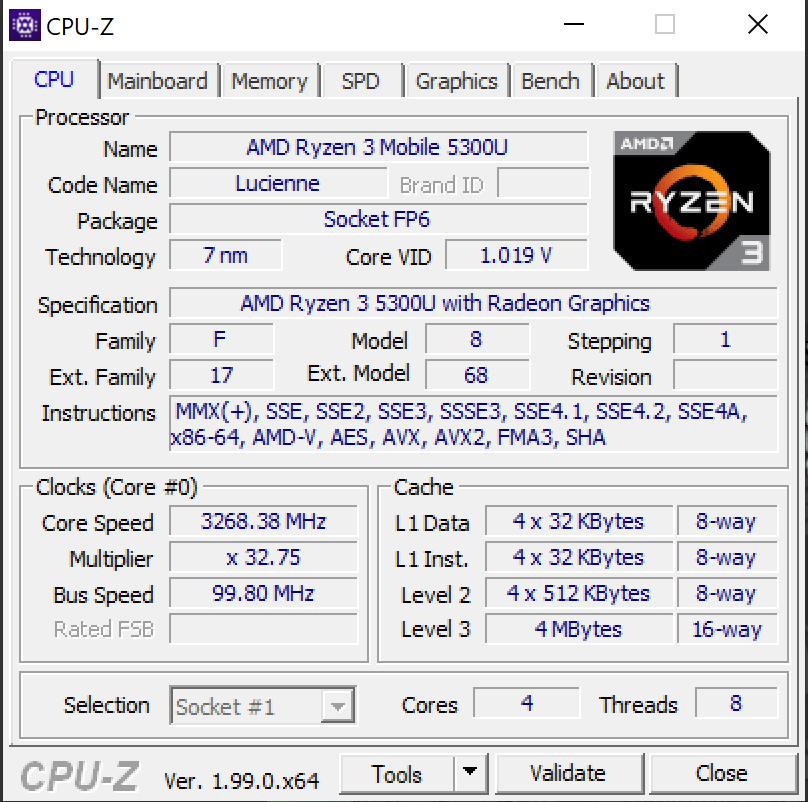
| Lower | AMD Ryzen 3 5300U | 497.6 GFLOPS | 83.0% |
3DMark CPU PROFILE MAX
| Rank | Hardware | Score | Performance Percentage |
|---|---|---|---|
| This Hardware | Intel Core i5 1335U | 4462 marks | 100% |
| Lower | Intel Core i5 1135G7 | 3441 marks | 77.1% |
| Lower | Intel Core i5 6300U | 924 marks | 20.7% |
3DMark CPU PROFILE 1 THREAD
| Rank | Hardware | Score | Performance Percentage |
|---|---|---|---|
| This Hardware | Intel Core i5 1335U | 975 marks | 100% |
| Lower | Intel Core i5 1135G7 | 846 marks | 86.8% |
| Lower | Intel Core i5 6300U | 466 marks | 47.8% |
CPU-Z Benchmark - Multi Thread
| Rank | Hardware | Score | Performance Percentage |
|---|---|---|---|
| This Hardware | Intel Core i5 1335U | 4589.9 points | 100% |
| Lower | Intel Core i5 1135G7 | 2462.5 marks | 53.7% |
| Lower | Intel Core i5 6300U | 817.6 points | 17.8% |
CPU-Z Benchmark - Single Thread
| Rank | Hardware | Score | Performance Percentage |
|---|---|---|---|
| This Hardware | Intel Core i5 1335U | 682.1 points | 100% |
| Lower | Intel Core i5 1135G7 | 504 marks | 73.9% |
| Lower | Intel Core i5 6300U | 289.8 points | 42.5% |
Geekbench3 - Multi Core
| Rank | Hardware | Score | Performance Percentage |
|---|---|---|---|
| This Hardware | Intel Core i5 1335U | 31332 points | 100% |
| Lower | Intel Core i5 1135G7 | 17993 points | 57.4% |
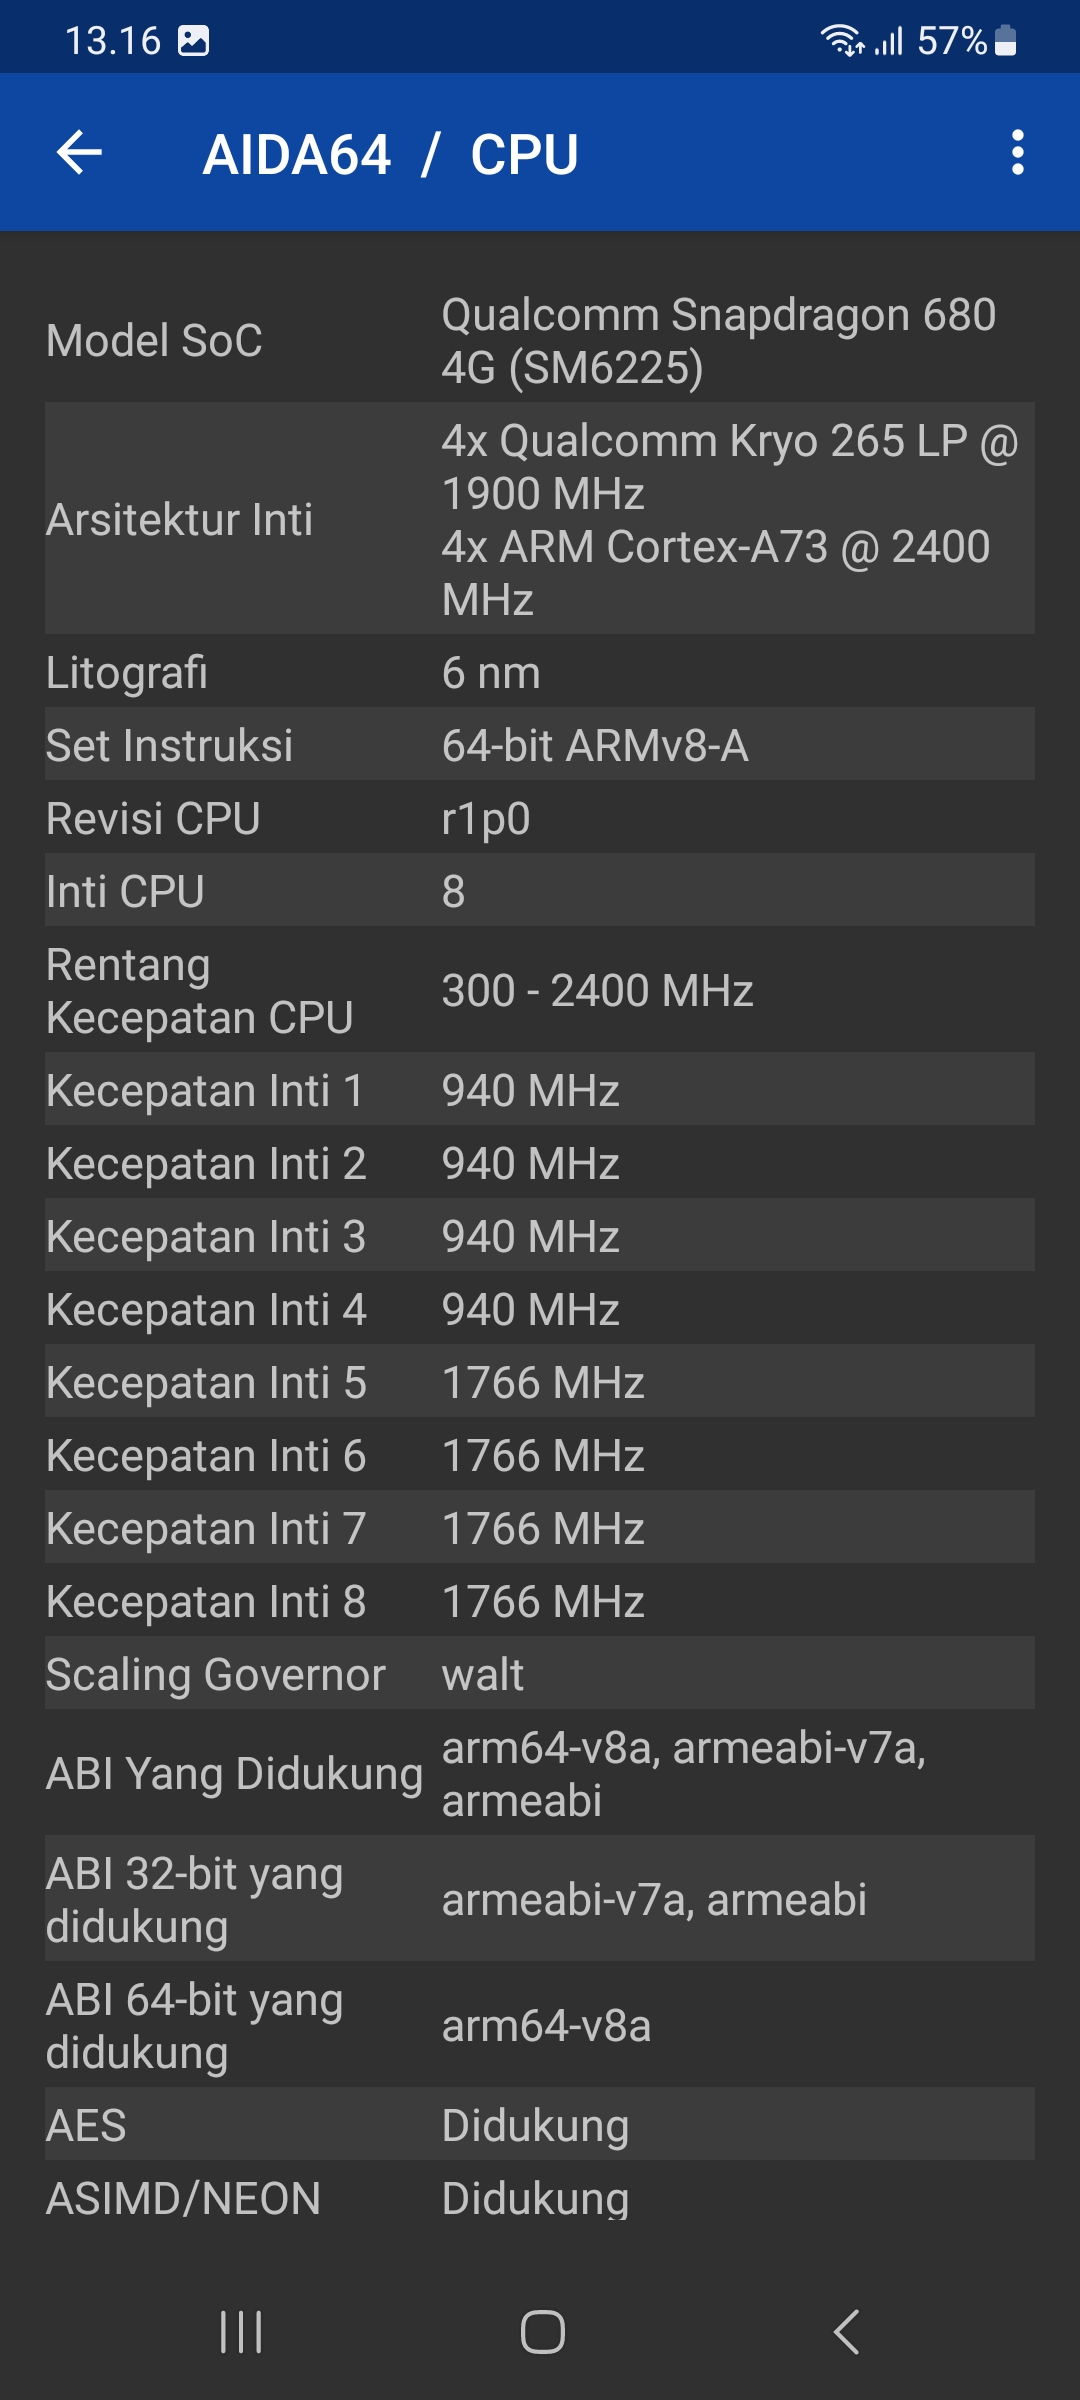
| Lower | Qualcomm SM6225 Snapdragon 680 4G | 8267 points | 26.4% |
Geekbench3 - Single Core
| Rank | Hardware | Score | Performance Percentage |
|---|---|---|---|
| This Hardware | Intel Core i5 1335U | 6182 points | 100% |
| Lower | Intel Core i5 1135G7 | 4933 points | 79.8% |
| Lower | Intel Core i5 6300U | 2561 points | 41.4% |
Geekbench4 - Multi Core
| Rank | Hardware | Score | Performance Percentage |
|---|---|---|---|
| This Hardware | Intel Core i5 1335U | 31691 points | 100% |
| Lower | Intel Core i5 1135G7 | 19133 points | 60.4% |
| Lower | Qualcomm SM6225 Snapdragon 680 4G | 6470 points | 20.4% |
Geekbench4 - Single Core
| Rank | Hardware | Score | Performance Percentage |
|---|---|---|---|
| This Hardware | Intel Core i5 1335U | 7387 points | 100% |
| Lower | Intel Core i5 1135G7 | 6098 points | 82.6% |
| Lower | Intel Core i5 6300U | 3309 points | 44.8% |
Geekbench5 - Multi Core
| Rank | Hardware | Score | Performance Percentage |
|---|---|---|---|
| This Hardware | Intel Core i5 1335U | 8114 points | 100% |
| Lower | Intel Core i5 1135G7 | 4699 points | 57.9% |
| Lower | Qualcomm SM6225 Snapdragon 680 4G | 1624 points | 20.0% |
Geekbench5 - Single Core
| Rank | Hardware | Score | Performance Percentage |
|---|---|---|---|
| This Hardware | Intel Core i5 1335U | 1698 points | 100% |
| Lower | Intel Core i5 1135G7 | 1403 points | 82.6% |
| Lower | Intel Core i5 6300U | 711 points | 41.9% |
Geekbench6 - Multi Core
| Rank | Hardware | Score | Performance Percentage |
|---|---|---|---|
| This Hardware | Intel Core i5 1335U | 8689 points | 100% |
| Lower | Intel Core i5 1135G7 | 5275 points | 60.7% |
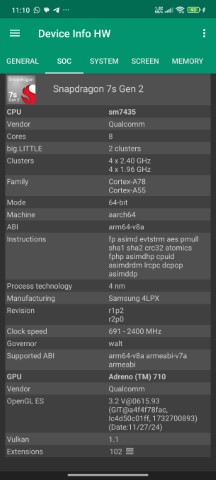
| Lower | Qualcomm SM7435-AB Snapdragon 7s Gen 2 | 2916 points | 33.6% |
Geekbench6 - Single Core
| Rank | Hardware | Score | Performance Percentage |
|---|---|---|---|
| This Hardware | Intel Core i5 1335U | 2285 points | 100% |
| Lower | Intel Core i5 1135G7 | 1784 points | 78.1% |
| Lower | Qualcomm SM7435-AB Snapdragon 7s Gen 2 | 1026 points | 44.9% |
PCMark10
| Rank | Hardware | Score | Performance Percentage |
|---|---|---|---|
| This Hardware | Intel Core i5 1335U | 5377 marks | 100% |
| Lower | Intel Core i5 1135G7 | 4692 marks | 87.3% |
| Lower | Intel Core i5 6300U | 2677 marks | 49.8% |
PCMark10 Extended
| Rank | Hardware | Score | Performance Percentage |
|---|---|---|---|
| This Hardware | Intel Core i5 1335U | 4874 marks | 100% |
PCMark10 Express
| Rank | Hardware | Score | Performance Percentage |
|---|---|---|---|
| This Hardware | Intel Core i5 1335U | 5225 marks | 100% |
Cinebench - 2003
| Rank | Hardware | Score | Performance Percentage |
|---|---|---|---|
| Higher | Intel Core i7 11700 | 8154 cb | 122.1% |
| This Hardware | Intel Core i5 1335U | 6677 cb | 100% |
| Lower | Intel Core i5 1135G7 | 4548 cb | 68.1% |
| Lower | Intel Core i7 7700K | 4315 cb | 64.6% |
About i5-1335U
The Intel Core i5-1335U is a mobile processor from the Raptor Lake family, launched in 2023 and aimed at thin-and-light laptops such as ultrabooks. This processor offers a 10-core hybrid architecture, consisting of 2 Performance cores (P-cores) and 8 Efficiency cores (E-cores), delivering a total of 12 threads to handle both heavy workloads and background tasks efficiently. With boost clock speeds up to 4.6 GHz on the P-cores, the i5-1335U provides excellent responsiveness for productivity, multitasking, and modern office applications.
Built on Intel 7 (10nm Enhanced SuperFin) process technology, the i5-1335U maintains a base TDP of 15W, making it suitable for long battery life and efficient thermal management in slim devices. For graphics processing, the integrated Intel Iris Xe Graphics delivers capable performance for video playback, creative work, and casual gaming, especially when paired with dual-channel memory configurations.
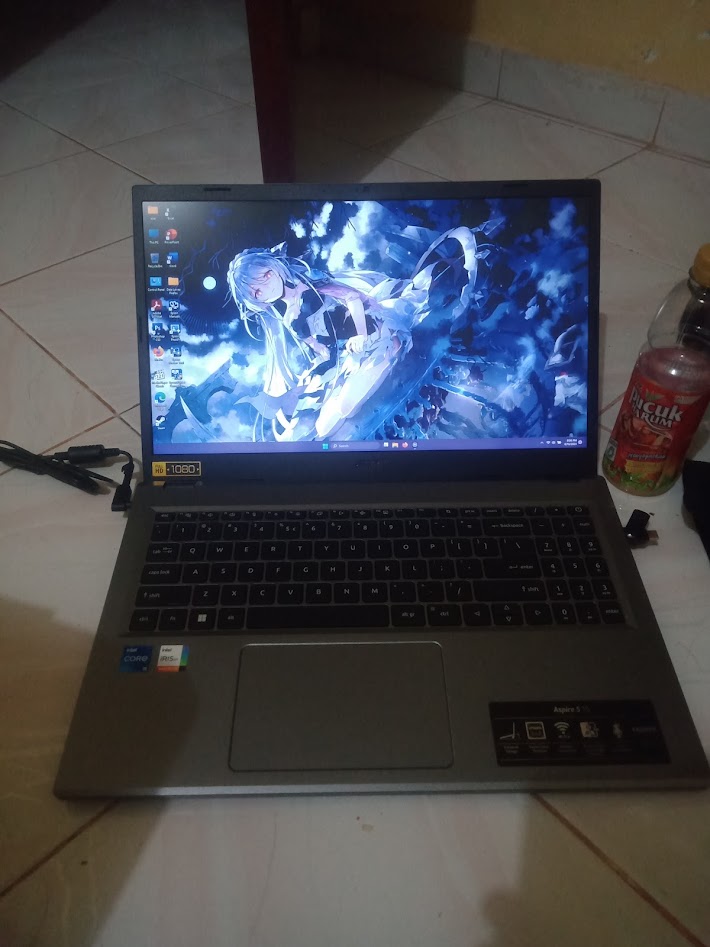
The i5-1335U is featured in devices like the Acer Aspire 5 A515-58P, which includes 8GB LPDDR5 RAM (non-upgradeable) and runs on Windows 11 22H2, offering a modern, smooth user experience. Overall, the Core i5-1335U is an ideal choice for students, professionals, and mobile users looking for a balance between performance and energy efficiency in daily computing.
Hardware Detail:
Device: Acer Aspire 5 A515-58P
RAM: 8GB LPDDR5 (Fix, Cannot Upgrade)
OS: Windows 11 22H2
Need Compare to Other Hardware?
You can compare Intel Core i5 1335U hardware with related hardware below


Related Hardware
Explore other Processors hardware that are related to Intel Core i5 1335U