
CINEBENCH - R20
10
of Total Submissions
13873 pts
of Total Score
Thursday, 01 January 1970 07:00 | Updated at 1 month ago
About Cinebench - R20
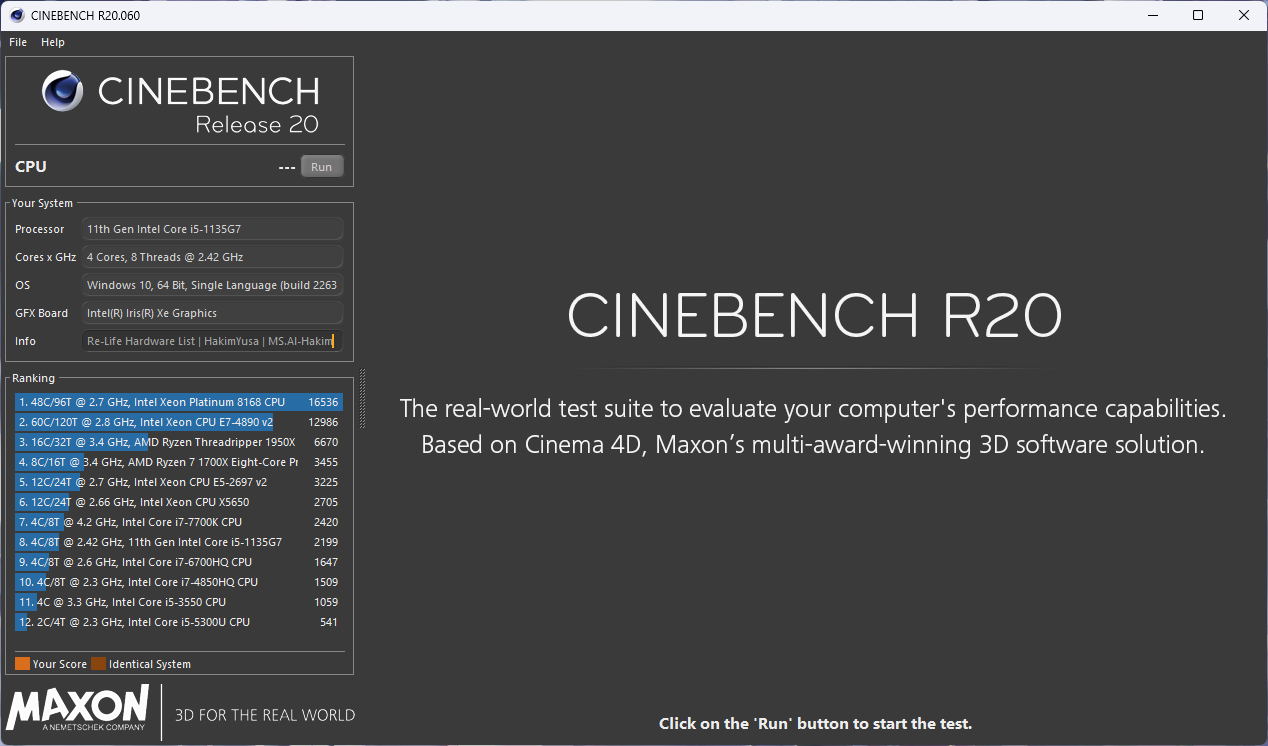
Cinebench R20 is one of the most popular CPU benchmarks developed by Maxon, the company behind the professional 3D animation software Cinema 4D. This benchmark is designed to test processor performance in complex photorealistic rendering scenarios, utilizing the latest rendering engine from Cinema 4D Release 20. Cinebench R20 provides a more demanding and realistic test compared to previous versions like R15, making it a relevant benchmark for modern systems and processors.
In this test, the system is designed to render a high-quality 3D scene that utilizes various advanced rendering techniques, such as global illumination, area shadows, physical materials, and full CPU utilization down to the smallest cores and threads. Cinebench R20 requires more memory, processing power, and longer render times, providing a more accurate representation of a processor's real-world performance, especially in demanding tasks like rendering, video editing, and 3D simulation.
Unlike previous versions, Cinebench R20 does not include GPU/OpenGL testing, so its primary focus is purely on the CPU's ability to handle multi-threaded workloads. The resulting scores are presented in points (pts), where higher values indicate the CPU's ability to complete rendering processes faster and more efficiently. This is crucial for content creators, designers, and professional users looking to select the best CPU for their productivity needs.
Cinebench R20 has become an industry standard for reviewers, overclockers, and technicians in objectively and consistently testing CPU performance. With workloads that reflect real-world scenarios and optimizations for modern processors, this benchmark remains one of the most important tools for evaluating and comparing system performance in depth.
Benchmark Cinebench - R20 Chart Ranking
The following graph displays the hardware performance ranking based on benchmark results using Cinebench - R20. The data is organized from highest to lowest score for easy visual comparison between devices. You can hover over each bar to view the score details and associated hardware name.
Benchmark Cinebench - R20 Table Ranking
The following table presents hardware rankings based on benchmark results using Cinebench - R20. The table format provides detailed views such as device name, score, number of submissions, as well as links to test results. It's perfect for those who want to see detailed data and easily search or filter.
| No. | Hardware | Submissions from Cinebench - R20 |
|---|---|---|
| 1 | Intel Core i7 11700 | 4217 pts |
| 2 | Intel Core i5 1335U | 3066 pts |
| 3 | Intel Core i7 7700K | 2222 pts |
| 4 | Intel Core i5 1135G7 | 2195 pts |
| 5 | Intel Core i5 6300U | 656 pts |
| 6 | Intel Core i7 720QM | 527 pts |
| 7 | Intel Core i3 2330M | 413 pts |
| 8 | AMD A6-3400M | 291 pts |
| 9 | Intel Celeron B815 | 207 pts |
| 10 | AMD E1-1200 | 79 pts |