
CINEBENCH - 2003
10
of Total Submissions
29616 cb
of Total Score
Thursday, 01 January 1970 07:00 | Updated at 1 month ago
About Cinebench - 2003
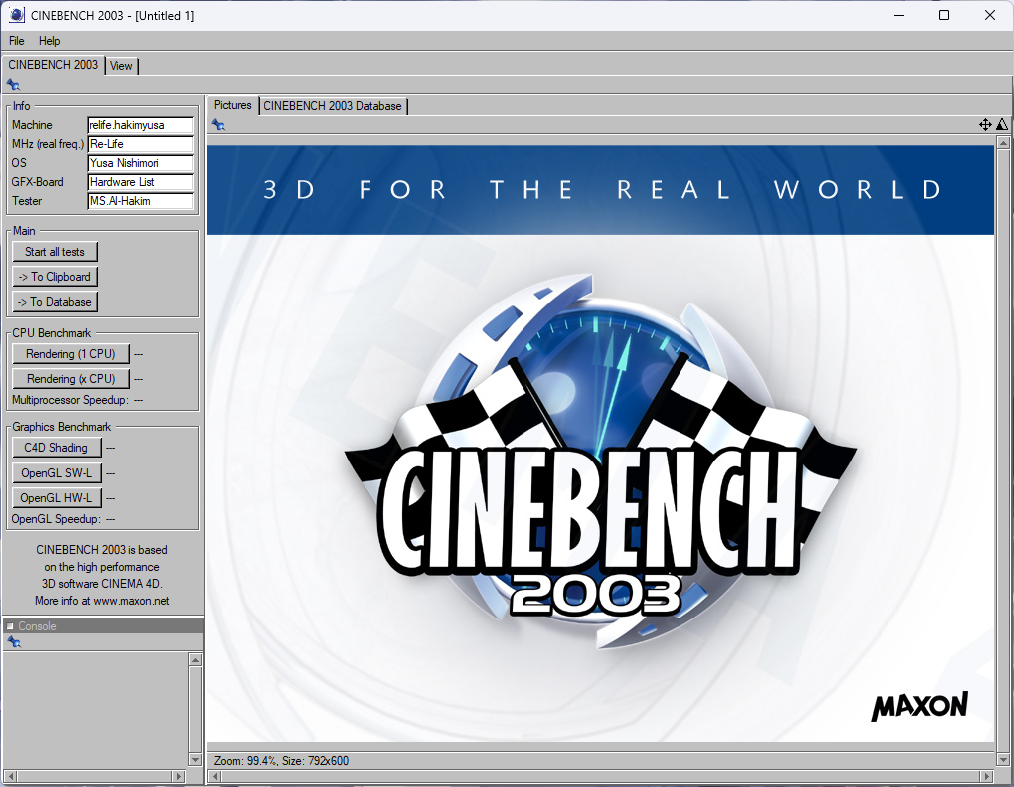
Cinebench 2003 is one of the early versions of the Cinebench suite of benchmark tools based on CINEMA 4D Release 8 software, a professional 3D application from MAXON. Although it's relatively old, Cinebench 2003 is still used by some tech enthusiasts and overclockers as a historical performance reference and comparison of processor architectures over time. The application is available for free and is compatible with both Windows and Mac OS operating systems.
This benchmark tests system performance through several rendering and graphics processing scenarios. The main test in Cinebench 2003 involves rendering 3D scenes using the CPU, which can measure the efficiency and computing power of up to 16 processor cores in a single system. The results are measured in the form of a score-the higher the score, the faster the processor completes the render job. This is very useful for evaluating the multi-core capabilities of CPUs, especially on early generation processors that are starting to support multiple cores.
In addition to CPU testing, Cinebench 2003 also includes an OpenGL-based graphics test, where thousands of animated polygons are rendered in real-time to assess the GPU's ability to handle complex graphical displays. This test is important for users who want to understand how their system handles viewport-based graphics workloads, such as those often found in 3D design and modeling software.
Although it has been replaced by more modern Cinebench versions such as R15, R20, and R23, Cinebench 2003 still has historical and technical value. Many benchmark data collectors and retro hardware enthusiasts use this version to consistently test and compare the performance of older systems. With a long track record of use and transparent testing methods, Cinebench 2003 is still relevant as a reference tool to see the evolution of CPU and GPU performance over time.
Benchmark Cinebench - 2003 Chart Ranking
The following graph displays the hardware performance ranking based on benchmark results using Cinebench - 2003. The data is organized from highest to lowest score for easy visual comparison between devices. You can hover over each bar to view the score details and associated hardware name.
Benchmark Cinebench - 2003 Table Ranking
The following table presents hardware rankings based on benchmark results using Cinebench - 2003. The table format provides detailed views such as device name, score, number of submissions, as well as links to test results. It's perfect for those who want to see detailed data and easily search or filter.
| No. | Hardware | Submissions from Cinebench - 2003 |
|---|---|---|
| 1 | Intel Core i7 11700 | 8154 cb |
| 2 | Intel Core i5 1335U | 6677 cb |
| 3 | Intel Core i5 1135G7 | 4548 cb |
| 4 | Intel Core i7 7700K | 4315 cb |
| 5 | Intel Core i5 6300U | 1601 cb |
| 6 | Intel Core i7 720QM | 1211 cb |
| 7 | Intel Core i3 2330M | 1067 cb |
| 8 | Intel Core 2 Duo E7500 | 986 cb |
| 9 | AMD A6-3400M | 765 cb |
| 10 | AMD E1-1200 | 292 cb |