
CINEBENCH - R15
12
of Total Submissions
9137 cb
of Total Score
Thursday, 01 January 1970 07:00 | Updated at 1 month ago
About Cinebench - R15
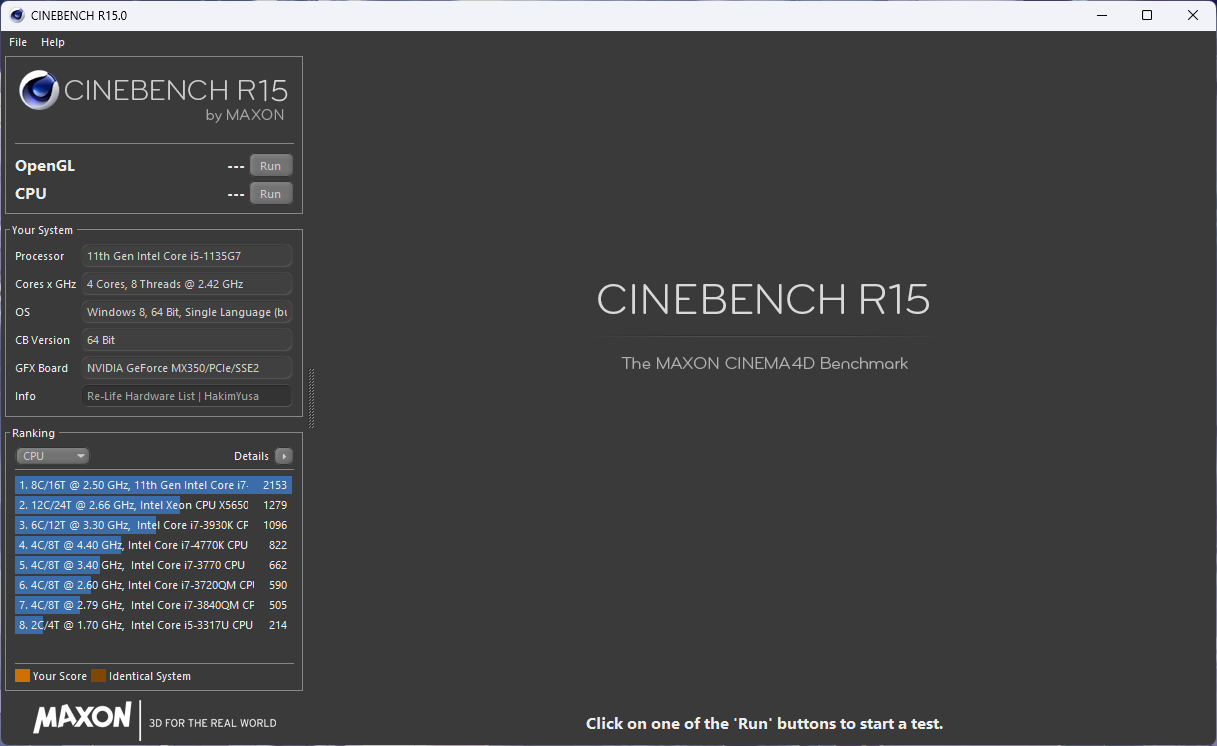
Cinebench R15 is one of the most popular CPU and GPU benchmarks developed by Maxon, the creator of CINEMA 4D software. Released at a time when quad-core processors were becoming commonplace, Cinebench R15 quickly became the standard tool for measuring the rendering performance of various types of desktop and laptop processors. This benchmark simulates the process of rendering photorealistic 3D graphics using the CINEMA 4D engine and assigns a score based on how quickly the CPU can complete the task.
In multi-core testing, Cinebench R15 utilizes all available threads and cores on the processor to render a complex scene consisting of over 300,000 polygons. This scene includes area lighting, soft shadows, sharp and blurry reflections, procedural textures, and anti-aliasing. All these elements are designed to place high stress on the entire CPU processing system, creating an environment that closely resembles real-world scenarios in digital content production or professional rendering.
Cinebench R15 scores are measured in “points” (pts), where higher numbers indicate better performance. This benchmark is ideal for evaluating rendering capabilities, multitasking performance, and overall processor efficiency, especially in applications that utilize multiple cores, such as Blender, Adobe Premiere, or CAD software.
Although Cinebench R15 has been replaced by newer versions like R20 and R23, Cinebench R15 is still widely used today due to its broad compatibility, lightweight execution, and consistent results. Especially for reviewers and users looking to compare processors across generations, R15 remains an important benchmark in the world of hardware and PC enthusiasts.
Benchmark Cinebench - R15 Chart Ranking
The following graph displays the hardware performance ranking based on benchmark results using Cinebench - R15. The data is organized from highest to lowest score for easy visual comparison between devices. You can hover over each bar to view the score details and associated hardware name.
Benchmark Cinebench - R15 Table Ranking
The following table presents hardware rankings based on benchmark results using Cinebench - R15. The table format provides detailed views such as device name, score, number of submissions, as well as links to test results. It's perfect for those who want to see detailed data and easily search or filter.
| No. | Hardware | Submissions from Cinebench - R15 |
|---|---|---|
| 1 | Intel Core i7 11700 | 2153 cb |
| 2 | Intel Core i9 11900F | 2034 cb |
| 3 | Intel Core i5 1335U | 1350 cb |
| 4 | Intel Core i5 1135G7 | 936 cb |
| 5 | Intel Core i7 7700K | 867 cb |
| 6 | AMD Ryzen 3 5300U | 851 cb |
| 7 | Intel Core i5 6300U | 262 cb |
| 8 | Intel Core i7 720QM | 220 cb |
| 9 | Intel Core i3 2330M | 163 cb |
| 10 | AMD A6-3400M | 153 cb |
| 11 | Intel Celeron B815 | 104 cb |
| 12 | AMD E1-1200 | 44 cb |