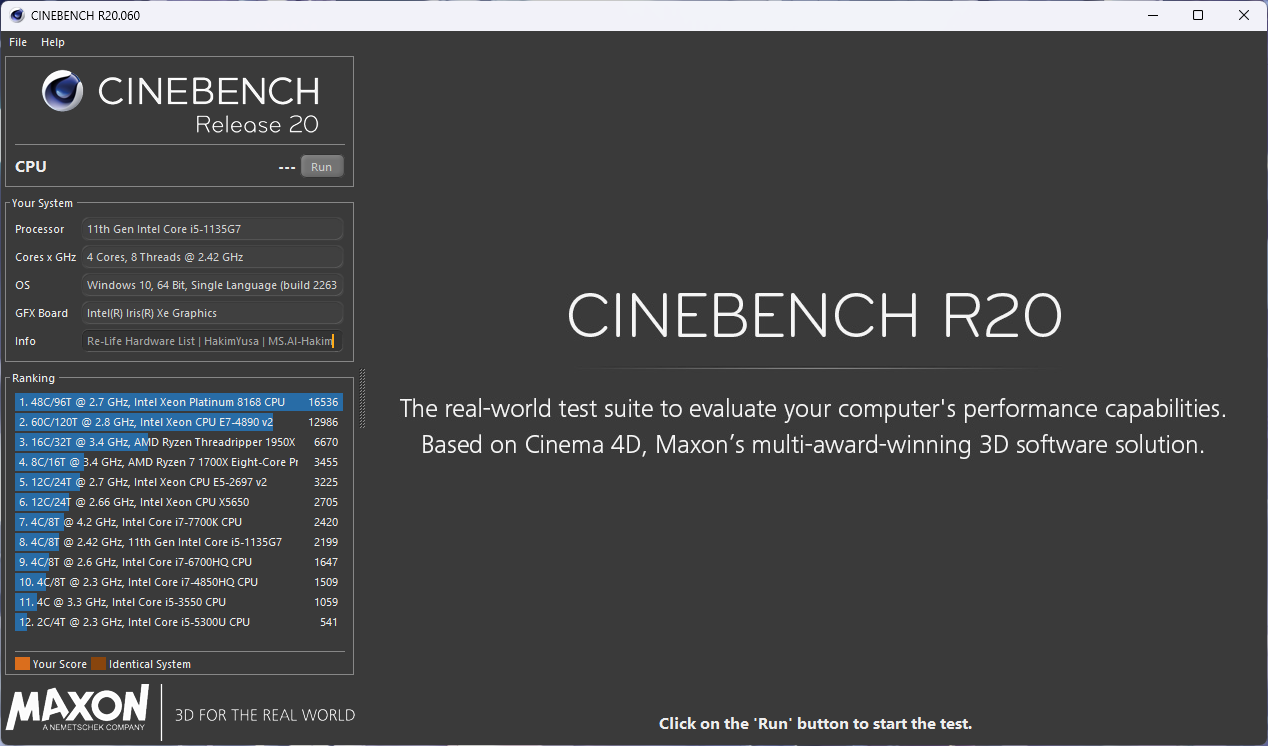
CINEBENCH - R20 SINGLE CORE
3
of Total Submissions
668 pts
of Total Score
Thursday, 01 January 1970 07:00 | Updated at 1 month ago
About Cinebench - R20 Single Core
Cinebench R20 Single Core is part of the Cinebench R20 benchmark suite that is specifically focused on measuring the performance of a single processor core (single-threaded performance). This benchmark is very important because many everyday applications, including lightweight software and most games, still rely on the performance of a single CPU core to handle important tasks such as application logic, user interface, and lightweight data processing quickly.
Unlike multi-core testing, which measures the collective strength of all processor cores, single-core testing reveals the efficiency and architecture of the CPU core itself. Using the complex rendering workload from Cinema 4D R20, Cinebench R20 Single Core presents a real-world workload that demands photorealistic rendering capabilities from a single CPU thread. This makes the benchmark score highly useful for comparing processor performance in light to medium usage scenarios.
Scores from Cinebench R20 Single Core are given in points (pts), where a higher score indicates better CPU performance in completing single-threaded tasks. This is particularly useful for users who want to know which processor excels in per-core efficiency, especially for tasks like software development, light editing, and gaming with engines that are still single-thread optimized.
Overall, Cinebench R20 Single Core remains an accurate and relevant tool for evaluating the real-world performance of modern processors, especially for users who want to choose the best CPU for needs that do not always require many cores but demand quick and efficient responses from each processor core.
Benchmark Cinebench - R20 Single Core Chart Ranking
The following graph displays the hardware performance ranking based on benchmark results using Cinebench - R20 Single Core. The data is organized from highest to lowest score for easy visual comparison between devices. You can hover over each bar to view the score details and associated hardware name.
Benchmark Cinebench - R20 Single Core Table Ranking
The following table presents hardware rankings based on benchmark results using Cinebench - R20 Single Core. The table format provides detailed views such as device name, score, number of submissions, as well as links to test results. It's perfect for those who want to see detailed data and easily search or filter.
| No. | Hardware | Submissions from Cinebench - R20 Single Core |
|---|---|---|
| 1 | Intel Core i5 1135G7 | 507 pts |
| 2 | Intel Core i7 720QM | 118 pts |
| 3 | AMD E1-1200 | 43 pts |
