
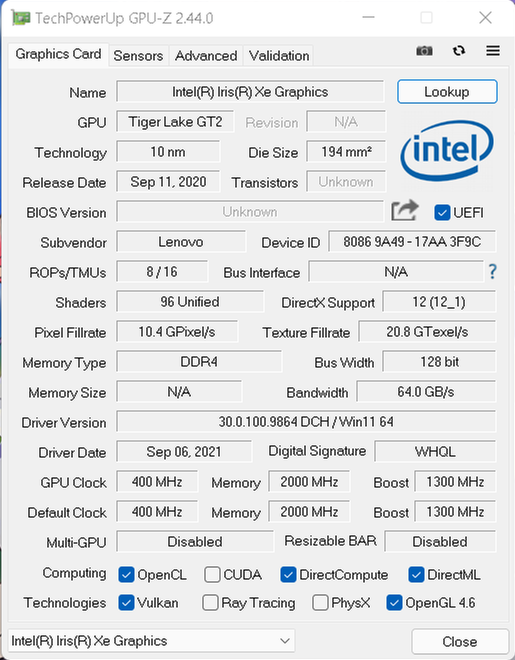
Intel Iris Xe Graphics Mobile (80EUs, Tiger Lake)
Architecture : Tiger Lake
Codename : Tiger Lake GT2
Chip : -
Core : 80
Memory : SHARED
Bus Width : 128 bit
Core Clock : 400MHz - 1300MHz
Memory Clock : 2000MHz
TDP : -
Technology : 10nm
Bus Interface : Integrated
CPU : Intel Core i5-1135G7
See more specification...
Friday, 06 August 2021 04:34 | Update at 1 month ago
Hardware Benchmark Record
This table displays the scores or sequential read & write speeds (for storage types) of various synthetic benchmark applications commonly used to test hardware performance. You can click on the score column to view the submissions page by ID. At that URL, you can browse the submitted results of each application, including viewing screenshots of the benchmark results. For screenshots of benchmark results, you can click the "View" button in the screenshot column.
In total, there are 50 submissions across 50 different benchmark applications, each testing the hardware from a unique angle. This variety allows you to draw a more comprehensive conclusion about the hardware's real-world performance.
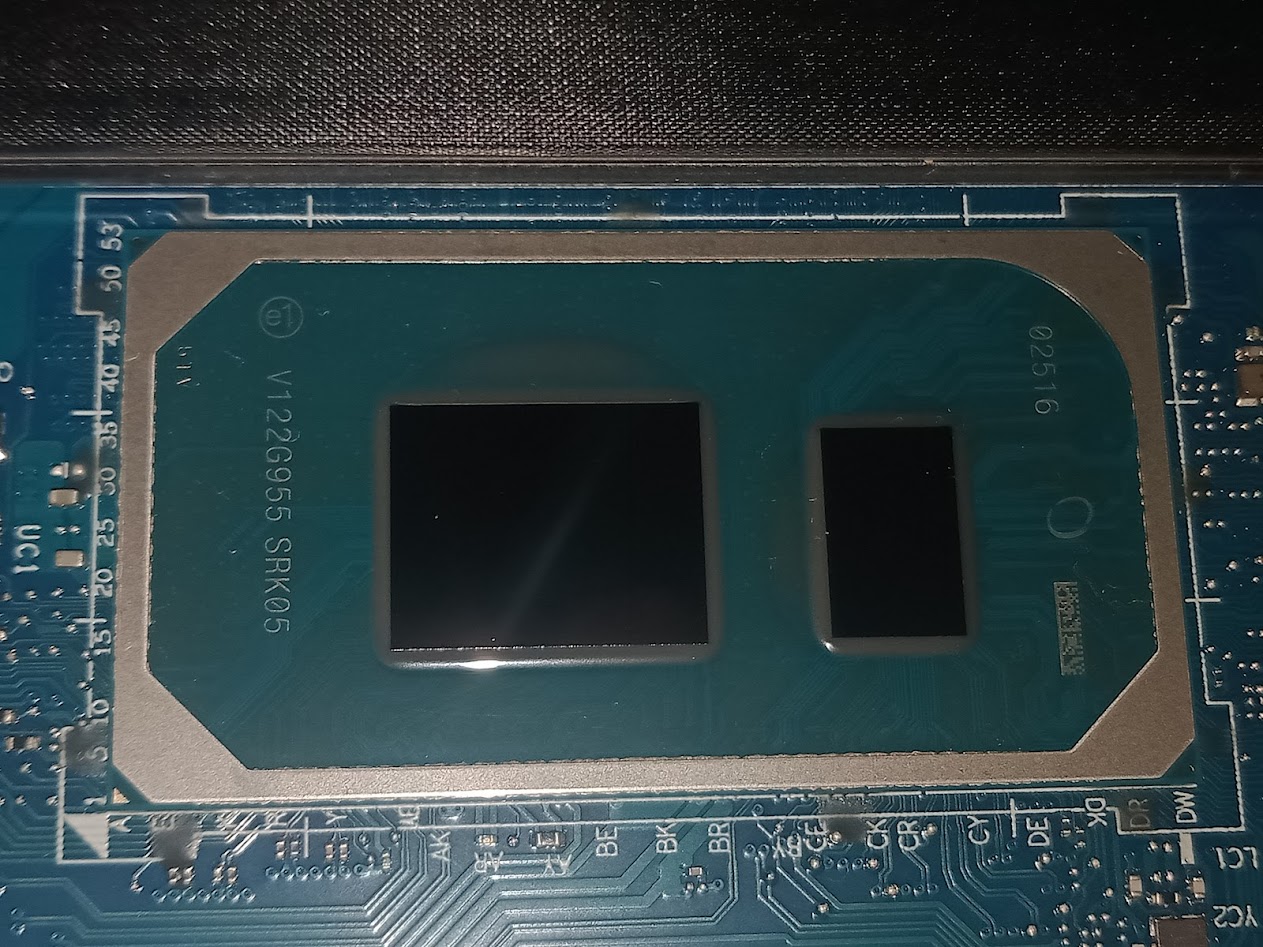
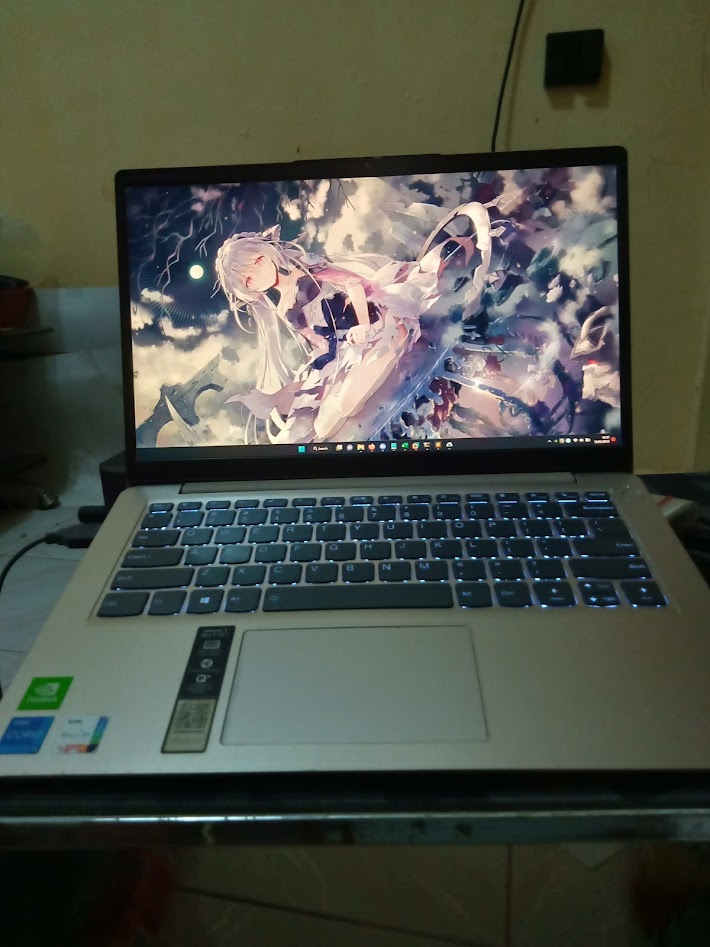
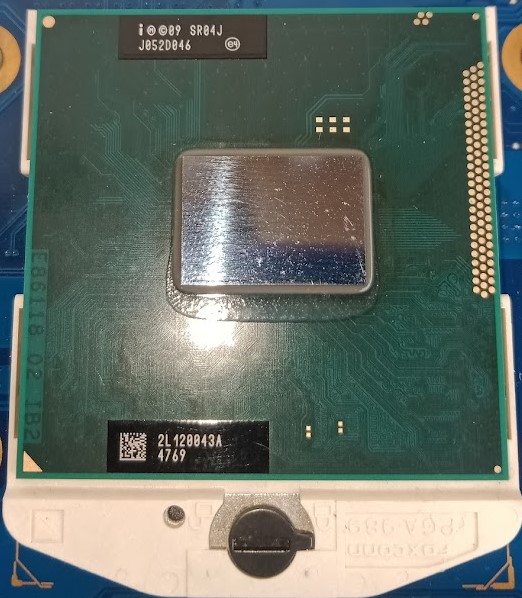
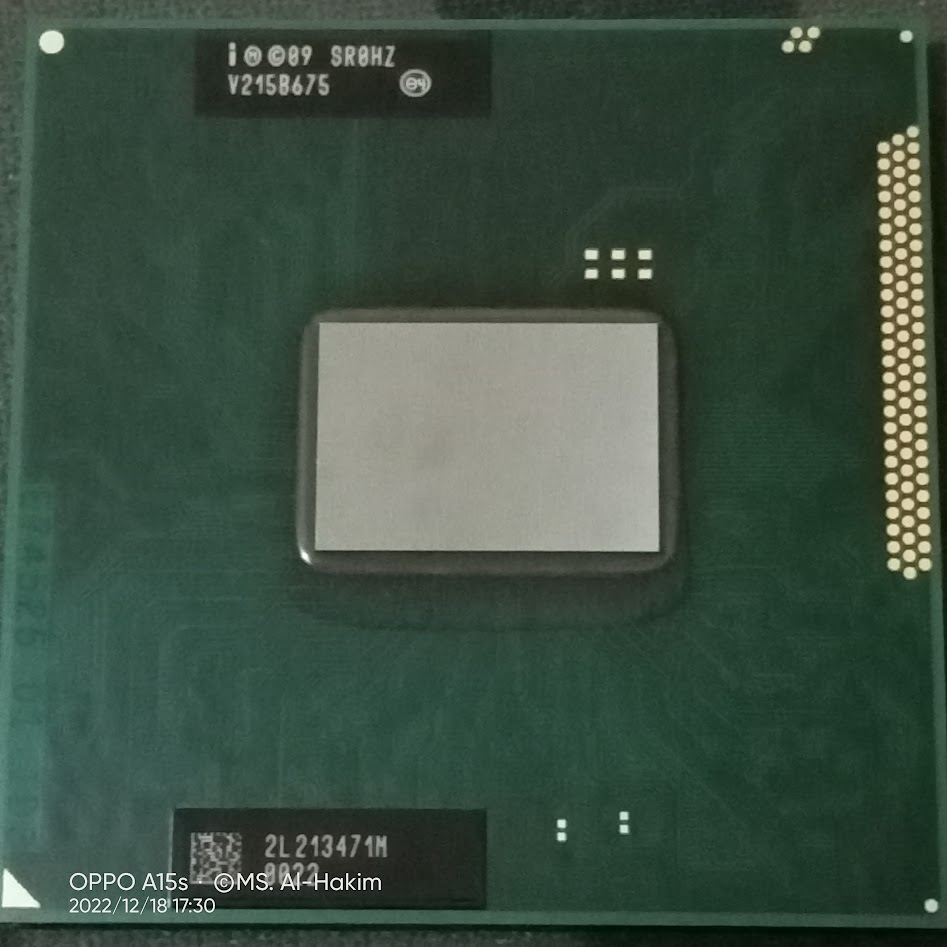
Media Gallery
A collection of photos of tested hardware. These images can help you identify the physical form, model, and variant of the hardware in question. These photos are from our own documentation, and if they are not available we may not be able to document them.

Nearby Competitors
Shows two other devices with slightly higher scores and two others with slightly lower scores on the same benchmarks. Useful to see how competitive these devices are.
3DMark - Cloud Gate
| Rank | Hardware | Score | Performance Percentage |
|---|---|---|---|
| Higher | AMD Radeon Graphics Mobile (Lucienne, 384 Shaders) | 15961 marks | 106.5% |
| Higher | NVIDIA GeForce MX350 | 17017 marks | 113.5% |
| This Hardware | Intel Iris Xe Graphics Mobile (80EUs, Tiger Lake) | 14993 marks | 100% |
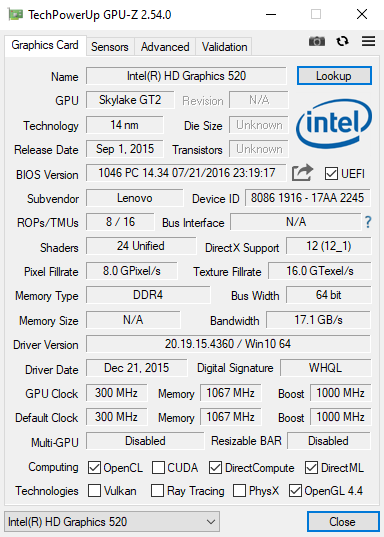
| Lower | Intel HD Graphics 520 (Mobile) | 4589 marks | 30.6% |
| Lower | AMD Radeon HD 6520G | 2348 marks | 15.7% |
3DMark - Fire Strike
| Rank | Hardware | Score | Performance Percentage |
|---|---|---|---|
| Higher | NVIDIA GeForce MX350 | 4013 marks | 143.8% |
| Higher | Intel Iris Xe Graphics Mobile (80EUs, Raptor Lake) | 4225 marks | 151.4% |
| This Hardware | Intel Iris Xe Graphics Mobile (80EUs, Tiger Lake) | 2791 marks | 100% |
| Lower | AMD Radeon Graphics Mobile (Lucienne, 384 Shaders) | 2468 marks | 88.4% |
| Lower | Intel HD Graphics 520 (Mobile) | 666 marks | 23.9% |
3DMark - Fire Strike (GPU)
| Rank | Hardware | Score | Performance Percentage |
|---|---|---|---|
| Higher | NVIDIA GeForce MX350 | 4225 marks | 141.9% |
| Higher | Intel Iris Xe Graphics Mobile (80EUs, Raptor Lake) | 4542 marks | 152.6% |
| This Hardware | Intel Iris Xe Graphics Mobile (80EUs, Tiger Lake) | 2977 marks | 100% |
| Lower | Intel HD Graphics 520 (Mobile) | 708 marks | 23.8% |
| Lower | AMD Radeon HD 7310 | 197 marks | 6.6% |
3DMark - Fire Strike Extreme
| Rank | Hardware | Score | Performance Percentage |
|---|---|---|---|
| Higher | NVIDIA GeForce MX350 | 1894 marks | 149.8% |
| Higher | Intel Iris Xe Graphics Mobile (80EUs, Raptor Lake) | 2049 marks | 162.1% |
| This Hardware | Intel Iris Xe Graphics Mobile (80EUs, Tiger Lake) | 1264 marks | 100% |
| Lower | Intel HD Graphics 520 (Mobile) | 314 marks | 24.8% |
| Lower | AMD Radeon HD 7310 | 78 marks | 6.2% |
3DMark - Fire Strike Ultra
| Rank | Hardware | Score | Performance Percentage |
|---|---|---|---|
| Higher | Intel Iris Xe Graphics Mobile (80EUs, Raptor Lake) | 1068 marks | 142.4% |
| This Hardware | Intel Iris Xe Graphics Mobile (80EUs, Tiger Lake) | 750 marks | 100% |
| Lower | NVIDIA GeForce MX350 | 543 marks | 72.4% |
| Lower | Intel HD Graphics 520 (Mobile) | 154 marks | 20.5% |
3DMark - Ice Storm
| Rank | Hardware | Score | Performance Percentage |
|---|---|---|---|
| Higher | NVIDIA GeForce MX350 | 75915 marks | 117.3% |
| Higher | Intel Iris Xe Graphics Mobile (80EUs, Raptor Lake) | 125130 marks | 193.4% |
| This Hardware | Intel Iris Xe Graphics Mobile (80EUs, Tiger Lake) | 64695 marks | 100% |
| Lower | Intel HD Graphics 520 (Mobile) | 36177 marks | 55.9% |
| Lower | Intel HD Graphics 3000 Mobile | 29702 marks | 45.9% |
3DMark - Ice Storm Extreme
| Rank | Hardware | Score | Performance Percentage |
|---|---|---|---|
| Higher | AMD Radeon Graphics Mobile (Lucienne, 384 Shaders) | 65366 marks | 130.7% |
| Higher | NVIDIA GeForce MX350 | 75116 marks | 150.1% |
| This Hardware | Intel Iris Xe Graphics Mobile (80EUs, Tiger Lake) | 50029 marks | 100% |
| Lower | Intel HD Graphics 520 (Mobile) | 27733 marks | 55.4% |
| Lower | Intel HD Graphics 3000 Mobile | 17915 marks | 35.8% |
3DMark - Ice Storm Unlimited
| Rank | Hardware | Score | Performance Percentage |
|---|---|---|---|
| Higher | Intel Iris Xe Graphics Mobile (80EUs, Raptor Lake) | 138590 marks | 132.9% |
| Higher | NVIDIA GeForce MX350 | 163808 marks | 157.1% |
| This Hardware | Intel Iris Xe Graphics Mobile (80EUs, Tiger Lake) | 104282 marks | 100% |
| Lower | Intel HD Graphics 520 (Mobile) | 52089 marks | 50.0% |
| Lower | Intel HD Graphics 3000 Mobile | 29806 marks | 28.6% |
3DMark - Night Raid
| Rank | Hardware | Score | Performance Percentage |
|---|---|---|---|
| Higher | NVIDIA GeForce MX350 | 15546 marks | 125.5% |
| Higher | Intel Iris Xe Graphics Mobile (80EUs, Raptor Lake) | 15869 marks | 128.1% |
| This Hardware | Intel Iris Xe Graphics Mobile (80EUs, Tiger Lake) | 12386 marks | 100% |
| Lower | Intel HD Graphics 520 (Mobile) | 2761 marks | 22.3% |
3DMark - Wild Life Extreme
| Rank | Hardware | Score | Performance Percentage |
|---|---|---|---|
| Higher | NVIDIA GeForce MX350 | 2916 marks | 143.1% |
| Higher | Intel Iris Xe Graphics Mobile (80EUs, Raptor Lake) | 3225 marks | 158.2% |
| This Hardware | Intel Iris Xe Graphics Mobile (80EUs, Tiger Lake) | 2038 marks | 100% |
| Lower | Qualcomm Adreno 710 | 792 marks | 38.9% |
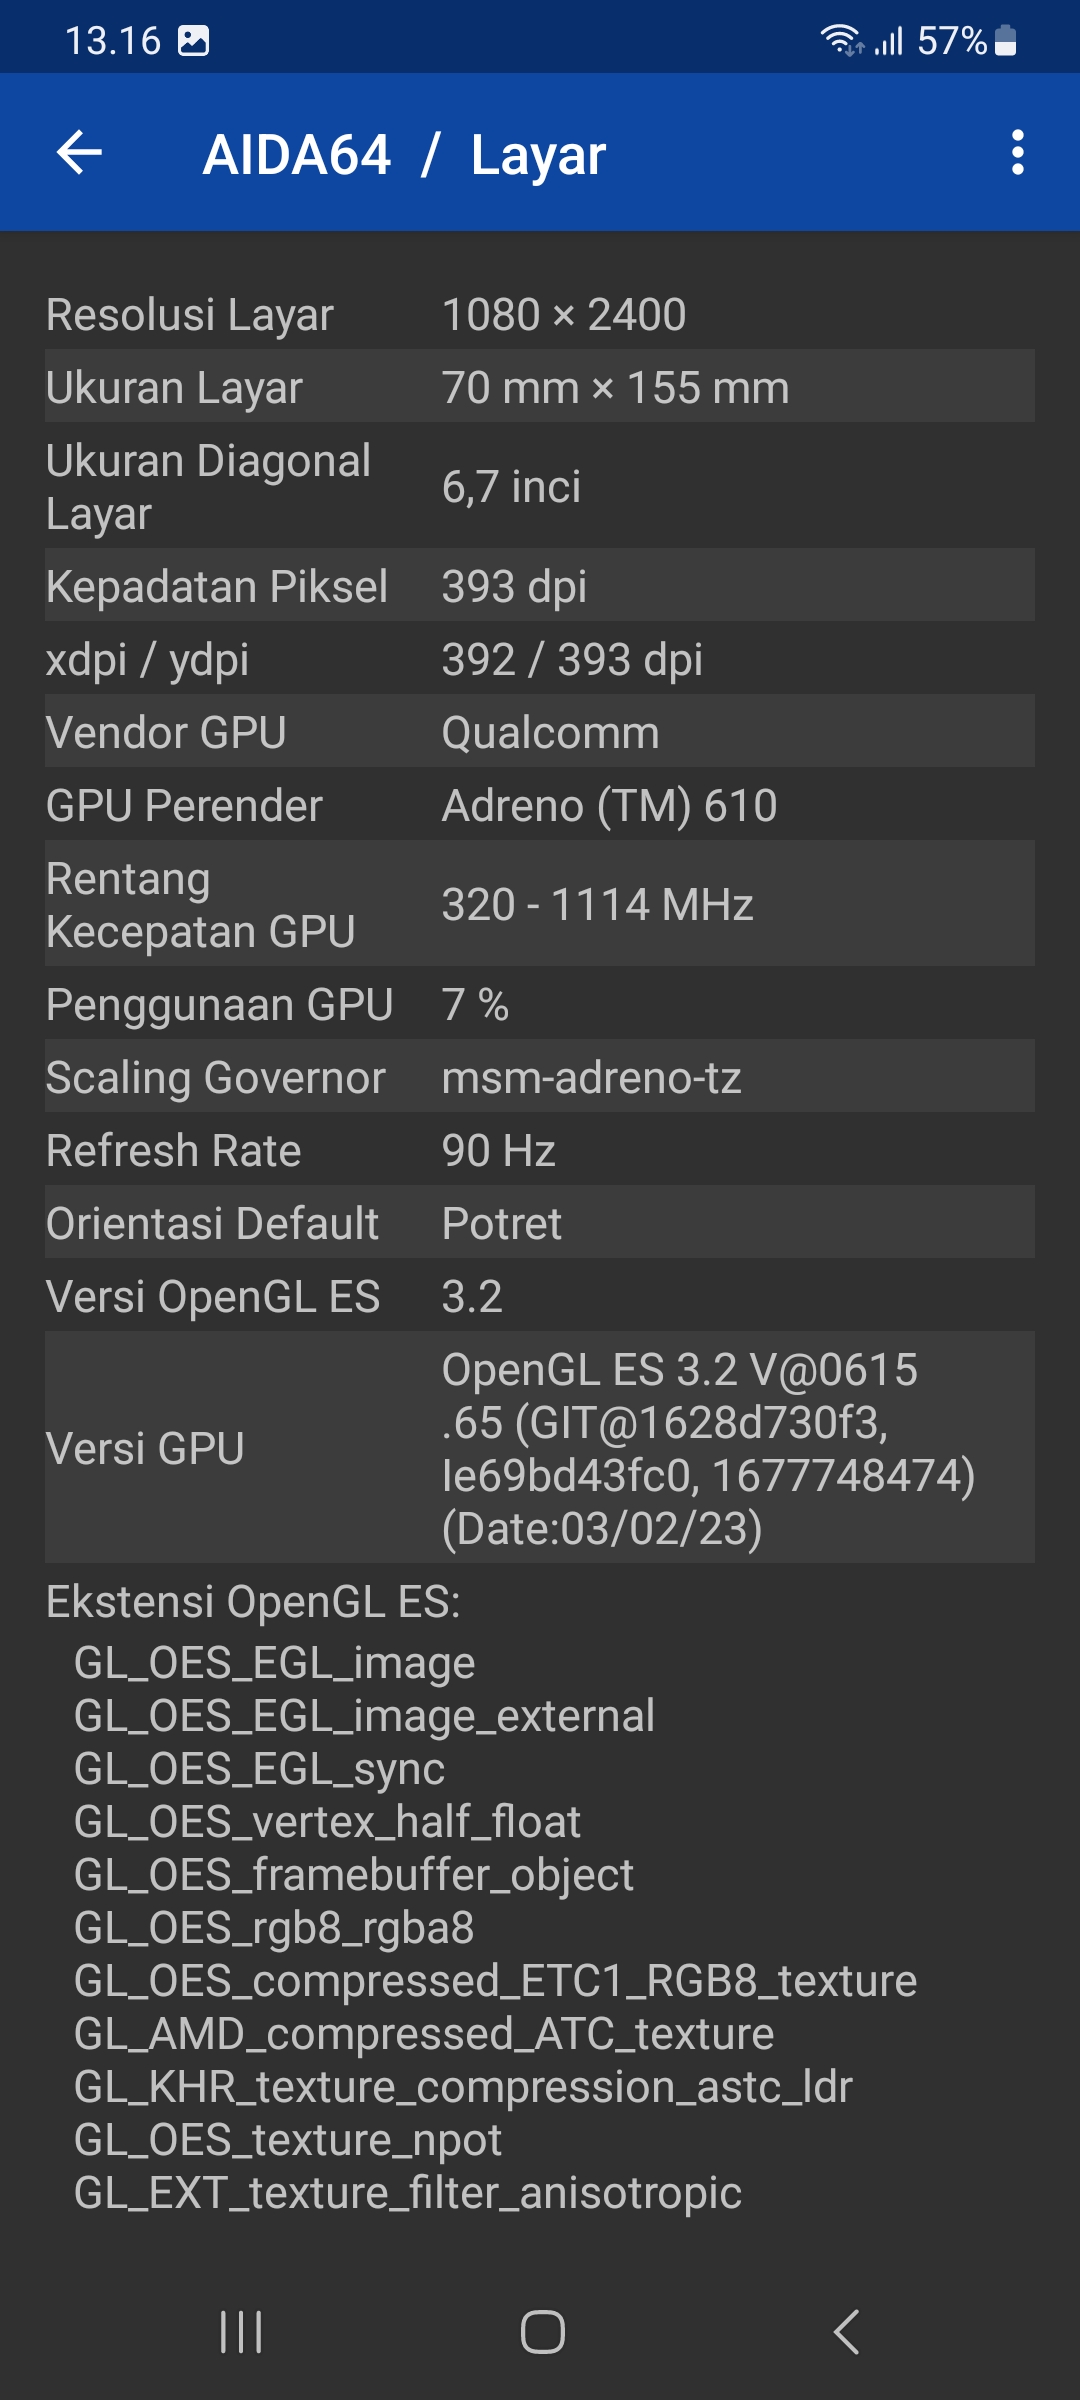
| Lower | Qualcomm Adreno 610 | 123 marks | 6.0% |
3DMark - Sky Diver
| Rank | Hardware | Score | Performance Percentage |
|---|---|---|---|
| Higher | Intel Iris Xe Graphics Mobile (80EUs, Raptor Lake) | 13486 marks | 125.4% |
| Higher | NVIDIA GeForce MX350 | 14051 marks | 130.7% |
| This Hardware | Intel Iris Xe Graphics Mobile (80EUs, Tiger Lake) | 10752 marks | 100% |
| Lower | AMD Radeon Graphics Mobile (Lucienne, 384 Shaders) | 8990 marks | 83.6% |
| Lower | Intel HD Graphics 520 (Mobile) | 2877 marks | 26.8% |
3DMark - Time Spy
| Rank | Hardware | Score | Performance Percentage |
|---|---|---|---|
| Higher | NVIDIA GeForce MX350 | 1403 marks | 119.0% |
| Higher | Intel Iris Xe Graphics Mobile (80EUs, Raptor Lake) | 1499 marks | 127.1% |
| This Hardware | Intel Iris Xe Graphics Mobile (80EUs, Tiger Lake) | 1179 marks | 100% |
| Lower | AMD Radeon Graphics Mobile (Lucienne, 384 Shaders) | 997 marks | 84.6% |
| Lower | Intel HD Graphics 520 (Mobile) | 256 marks | 21.7% |
3DMark - Wild Life
| Rank | Hardware | Score | Performance Percentage |
|---|---|---|---|
| Higher | NVIDIA GeForce MX350 | 9350 marks | 147.9% |
| Higher | Intel Iris Xe Graphics Mobile (80EUs, Raptor Lake) | 11497 marks | 181.9% |
| This Hardware | Intel Iris Xe Graphics Mobile (80EUs, Tiger Lake) | 6320 marks | 100% |
| Lower | Qualcomm Adreno 610 | 589 marks | 9.3% |
3DMark Vantage - Extreme
| Rank | Hardware | Score | Performance Percentage |
|---|---|---|---|
| Higher | NVIDIA GeForce MX350 | 10057 marks | 148.6% |
| This Hardware | Intel Iris Xe Graphics Mobile (80EUs, Tiger Lake) | 6770 marks | 100% |
| Lower | AMD/ATI Mobility Radeon HD 5450 | 504 marks | 7.4% |
| Lower | AMD Radeon HD 7310 | 321 marks | 4.7% |
3DMark Vantage - Performance
| Rank | Hardware | Score | Performance Percentage |
|---|---|---|---|
| Higher | NVIDIA GeForce MX350 | 20986 marks | 132.1% |
| This Hardware | Intel Iris Xe Graphics Mobile (80EUs, Tiger Lake) | 15888 marks | 100% |
| Lower | AMD/ATI Mobility Radeon HD 5450 | 1420 marks | 8.9% |
| Lower | AMD Radeon HD 7310 | 843 marks | 5.3% |
3DMark Vantage - Performance (GPU)
| Rank | Hardware | Score | Performance Percentage |
|---|---|---|---|
| Higher | NVIDIA GeForce MX350 | 18982 marks | 139.5% |
| This Hardware | Intel Iris Xe Graphics Mobile (80EUs, Tiger Lake) | 13609 marks | 100% |
| Lower | AMD Radeon HD 7310 | 715 marks | 5.3% |
3DMark03
| Rank | Hardware | Score | Performance Percentage |
|---|---|---|---|
| Higher | NVIDIA GeForce MX350 | 65858 marks | 171.3% |
| This Hardware | Intel Iris Xe Graphics Mobile (80EUs, Tiger Lake) | 38437 marks | 100% |
| Lower | AMD Radeon HD 6520G | 9565 marks | 24.9% |
| Lower | Intel HD Graphics 3000 Mobile | 9179 marks | 23.9% |
3DMark05
| Rank | Hardware | Score | Performance Percentage |
|---|---|---|---|
| Higher | NVIDIA GeForce MX350 | 38008 marks | 136.6% |
| This Hardware | Intel Iris Xe Graphics Mobile (80EUs, Tiger Lake) | 27824 marks | 100% |
| Lower | Intel HD Graphics 3000 Mobile | 6769 marks | 24.3% |
| Lower | AMD Radeon HD 6520G | 5959 marks | 21.4% |
3DMark06
| Rank | Hardware | Score | Performance Percentage |
|---|---|---|---|
| Higher | NVIDIA GeForce MX350 | 28710 marks | 148.6% |
| This Hardware | Intel Iris Xe Graphics Mobile (80EUs, Tiger Lake) | 19315 marks | 100% |
| Lower | Intel HD Graphics 3000 Mobile | 3874 marks | 20.1% |
| Lower | AMD Radeon HD 6520G | 3658 marks | 18.9% |
3DMark11 - Entry
| Rank | Hardware | Score | Performance Percentage |
|---|---|---|---|
| Higher | NVIDIA GeForce MX350 | 9326 marks | 108.4% |
| This Hardware | Intel Iris Xe Graphics Mobile (80EUs, Tiger Lake) | 8601 marks | 100% |
| Lower | AMD Radeon HD 6520G | 905 marks | 10.5% |
| Lower | AMD/ATI Mobility Radeon HD 5450 | 705 marks | 8.2% |
3DMark11 - Extreme
| Rank | Hardware | Score | Performance Percentage |
|---|---|---|---|
| Higher | NVIDIA GeForce MX350 | 2077 marks | 201.8% |
| This Hardware | Intel Iris Xe Graphics Mobile (80EUs, Tiger Lake) | 1029 marks | 100% |
| Lower | AMD Radeon HD 6520G | 173 marks | 16.8% |
| Lower | AMD/ATI Mobility Radeon HD 5450 | 137 marks | 13.3% |
3DMark11 - Performance
| Rank | Hardware | Score | Performance Percentage |
|---|---|---|---|
| Higher | NVIDIA GeForce MX350 | 6075 marks | 122.1% |
| This Hardware | Intel Iris Xe Graphics Mobile (80EUs, Tiger Lake) | 4975 marks | 100% |
| Lower | AMD Radeon HD 6520G | 548 marks | 11.0% |
| Lower | AMD/ATI Mobility Radeon HD 5450 | 452 marks | 9.1% |
3DMark2000
| Rank | Hardware | Score | Performance Percentage |
|---|---|---|---|
| Higher | Intel HD Graphics 3000 Mobile | 5901 marks | 136.6% |
| Higher | AMD Radeon HD 7310 | 7087 marks | 164.1% |
| This Hardware | Intel Iris Xe Graphics Mobile (80EUs, Tiger Lake) | 4319 marks | 100% |
| Lower | AMD/ATI Mobility Radeon HD 5450 | 3549 marks | 82.2% |
3DMark2001 SE
| Rank | Hardware | Score | Performance Percentage |
|---|---|---|---|
| This Hardware | Intel Iris Xe Graphics Mobile (80EUs, Tiger Lake) | 39293 marks | 100% |
| Lower | Intel HD Graphics 3000 Mobile | 13173 marks | 33.5% |
| Lower | AMD Radeon HD 6520G | 12567 marks | 32.0% |
Aquamark
| Rank | Hardware | Score | Performance Percentage |
|---|---|---|---|
| Higher | NVIDIA GeForce MX350 | 244805 marks | 110.7% |
| This Hardware | Intel Iris Xe Graphics Mobile (80EUs, Tiger Lake) | 221104 marks | 100% |
| Lower | AMD/ATI Mobility Radeon HD 5450 | 72508 marks | 32.8% |
| Lower | AMD Radeon HD 7310 | 38147 marks | 17.3% |
Catzilla - 576p
| Rank | Hardware | Score | Performance Percentage |
|---|---|---|---|
| Higher | NVIDIA GeForce MX350 | 10965 marks | 223.6% |
| This Hardware | Intel Iris Xe Graphics Mobile (80EUs, Tiger Lake) | 4903 marks | 100% |
| Lower | AMD/ATI Mobility Radeon HD 5450 | 872 marks | 17.8% |
| Lower | AMD Radeon HD 7310 | 371 marks | 7.6% |
Catzilla - 720p
| Rank | Hardware | Score | Performance Percentage |
|---|---|---|---|
| Higher | NVIDIA GeForce MX350 | 8429 marks | 207.3% |
| This Hardware | Intel Iris Xe Graphics Mobile (80EUs, Tiger Lake) | 4067 marks | 100% |
| Lower | AMD/ATI Mobility Radeon HD 5450 | 649 marks | 16.0% |
| Lower | AMD Radeon HD 7310 | 318 marks | 7.8% |
Geekbench4 - Compute
| Rank | Hardware | Score | Performance Percentage |
|---|---|---|---|
| Higher | Intel Iris Xe Graphics Mobile (80EUs, Raptor Lake) | 50025 points | 133.8% |
| Higher | NVIDIA GeForce MX350 | 60926 points | 162.9% |
| This Hardware | Intel Iris Xe Graphics Mobile (80EUs, Tiger Lake) | 37395 points | 100% |
| Lower | Intel HD Graphics 520 (Mobile) | 13866 points | 37.1% |
| Lower | Qualcomm Adreno 610 | 5037 points | 13.5% |
Geekbench5 - Compute
| Rank | Hardware | Score | Performance Percentage |
|---|---|---|---|
| Higher | Intel Iris Xe Graphics Mobile (80EUs, Raptor Lake) | 14320 points | 115.1% |
| Higher | NVIDIA GeForce MX350 | 15633 points | 125.6% |
| This Hardware | Intel Iris Xe Graphics Mobile (80EUs, Tiger Lake) | 12442 points | 100% |
| Lower | Intel HD Graphics 520 (Mobile) | 3437 points | 27.6% |
| Lower | Qualcomm Adreno 610 | 453 points | 3.6% |
Unigine Heaven - Basic
| Rank | Hardware | Score | Performance Percentage |
|---|---|---|---|
| Higher | NVIDIA GeForce MX350 | 2256.95 DX9 marks | 200.8% |
| This Hardware | Intel Iris Xe Graphics Mobile (80EUs, Tiger Lake) | 1124.15 DX9 marks | 100% |
| Lower | AMD Radeon HD 7310 | 120.32 DX9 marks | 10.7% |
Unigine Heaven - Xtreme
| Rank | Hardware | Score | Performance Percentage |
|---|---|---|---|
| Higher | NVIDIA GeForce MX350 | 1139.72 DX11 marks | 239.0% |
| This Hardware | Intel Iris Xe Graphics Mobile (80EUs, Tiger Lake) | 476.96 DX11 marks | 100% |
Unigine Superposition - 1080P Xtreme
| Rank | Hardware | Score | Performance Percentage |
|---|---|---|---|
| This Hardware | Intel Iris Xe Graphics Mobile (80EUs, Tiger Lake) | 692 points | 100% |
| Lower | NVIDIA GeForce MX350 | 511 points | 73.8% |
Unigine Superposition - 8K Optimize
| Rank | Hardware | Score | Performance Percentage |
|---|---|---|---|
| This Hardware | Intel Iris Xe Graphics Mobile (80EUs, Tiger Lake) | 272 points | 100% |
VRMark - Orange Room
| Rank | Hardware | Score | Performance Percentage |
|---|---|---|---|
| This Hardware | Intel Iris Xe Graphics Mobile (80EUs, Tiger Lake) | 1476 marks | 100% |
Cinebench (GPU OpenGL) - R15
| Rank | Hardware | Score | Performance Percentage |
|---|---|---|---|
| Higher | NVIDIA GeForce MX350 | 119.52 FPS | 158.2% |
| Higher | AMD Radeon RX 640 4GB (OEM) | 125.39 FPS | 165.9% |
| This Hardware | Intel Iris Xe Graphics Mobile (80EUs, Tiger Lake) | 75.57 FPS | 100% |
| Lower | AMD Radeon Graphics Mobile (Lucienne, 384 Shaders) | 58.92 FPS | 78.0% |
| Lower | AMD Radeon HD 7310 | 6.56 FPS | 8.7% |
Unigine Heaven - Basic DX9
| Rank | Hardware | Score | Performance Percentage |
|---|---|---|---|
| Higher | NVIDIA GeForce MX350 | 74.0 FPS | 155.1% |
| This Hardware | Intel Iris Xe Graphics Mobile (80EUs, Tiger Lake) | 47.7 FPS | 100% |
| Lower | AMD Radeon HD 7310 | 4.1 FPS | 8.6% |
Unigine Heaven - Extreme DX11
| Rank | Hardware | Score | Performance Percentage |
|---|---|---|---|
| Higher | NVIDIA GeForce MX350 | 23.9 FPS | 181.1% |
| This Hardware | Intel Iris Xe Graphics Mobile (80EUs, Tiger Lake) | 13.2 FPS | 100% |
Unigine Valley - Basic DX9
| Rank | Hardware | Score | Performance Percentage |
|---|---|---|---|
| Higher | NVIDIA GeForce MX350 | 72.4 FPS | 191.5% |
| This Hardware | Intel Iris Xe Graphics Mobile (80EUs, Tiger Lake) | 37.8 FPS | 100% |
| Lower | AMD Radeon HD 7310 | 3.6 FPS | 9.5% |
Unigine Valley - Extreme OpenGL
| Rank | Hardware | Score | Performance Percentage |
|---|---|---|---|
| This Hardware | Intel Iris Xe Graphics Mobile (80EUs, Tiger Lake) | 13.6 FPS | 100% |
Unigine Valley - Extreme HD DX11
| Rank | Hardware | Score | Performance Percentage |
|---|---|---|---|
| Higher | NVIDIA GeForce MX350 | 21.0 FPS | 269.2% |
| This Hardware | Intel Iris Xe Graphics Mobile (80EUs, Tiger Lake) | 7.8 FPS | 100% |
GFXBench (Aztec Ruins) - DX12
| Rank | Hardware | Score | Performance Percentage |
|---|---|---|---|
| Higher | NVIDIA GeForce MX350 | 63.5 FPS | 181.9% |
| This Hardware | Intel Iris Xe Graphics Mobile (80EUs, Tiger Lake) | 34.9 FPS | 100% |
GFXBench (Aztec Ruins) - VULKAN
| Rank | Hardware | Score | Performance Percentage |
|---|---|---|---|
| Higher | NVIDIA GeForce MX350 | 73.6 FPS | 214.6% |
| This Hardware | Intel Iris Xe Graphics Mobile (80EUs, Tiger Lake) | 34.3 FPS | 100% |
| Lower | Qualcomm Adreno 610 | 5 FPS | 14.6% |
| Lower | IMG PowerVR Rogue GE8320 680MHz | 3.8 FPS | 11.1% |
GFXBench (Aztec Ruins) - DX11
| Rank | Hardware | Score | Performance Percentage |
|---|---|---|---|
| Higher | NVIDIA GeForce MX350 | 65.8 FPS | 155.6% |
| This Hardware | Intel Iris Xe Graphics Mobile (80EUs, Tiger Lake) | 42.3 FPS | 100% |
| Lower | AMD Radeon HD 7310 | 5.6 FPS | 13.2% |
Cinebench (GPU OpenGL) - 2003 HW-L
| Rank | Hardware | Score | Performance Percentage |
|---|---|---|---|
| This Hardware | Intel Iris Xe Graphics Mobile (80EUs, Tiger Lake) | 11954 CB-GFX | 100% |
| Lower | NVIDIA GeForce MX350 | 8243 CB-GFX | 69.0% |
| Lower | AMD Radeon HD 7310 | 1654 CB-GFX | 13.8% |
Cinebench (GPU OpenGL) - R11.5
| Rank | Hardware | Score | Performance Percentage |
|---|---|---|---|
| Higher | NVIDIA GeForce MX350 | 73.61 FPS | 123.5% |
| Higher | AMD Radeon RX 640 4GB (OEM) | 118.31 FPS | 198.4% |
| This Hardware | Intel Iris Xe Graphics Mobile (80EUs, Tiger Lake) | 59.62 FPS | 100% |
| Lower | AMD Radeon HD 7310 | 7.16 FPS | 12.0% |
PassMark - PerformanceTest (2D Mark)
| Rank | Hardware | Score | Performance Percentage |
|---|---|---|---|
| Higher | ARM Mali-450 MP | 4857 marks | 184.4% |
| Higher | ARM Mali-T860 MP2 | 7255 points | 275.4% |
| This Hardware | Intel Iris Xe Graphics Mobile (80EUs, Tiger Lake) | 2634 marks | 100% |
| Lower | NVIDIA GeForce MX350 | 272 marks | 10.3% |
| Lower | AMD Radeon HD 7310 | 3.0 marks | 0.1% |
PassMark - PerformanceTest (3D Mark)
| Rank | Hardware | Score | Performance Percentage |
|---|---|---|---|
| Higher | IMG PowerVR Rogue GE8320 650MHz | 2885 marks | 991.4% |
| Higher | IMG PowerVR Rogue GE8320 680MHz | 3232 points | 1,110.7% |
| This Hardware | Intel Iris Xe Graphics Mobile (80EUs, Tiger Lake) | 291 marks | 100% |
| Lower | AMD Radeon HD 7310 | 128 marks | 44.0% |
AIDA64 GPGPU Benchmark - Single Precision FLOPS
| Rank | Hardware | Score | Performance Percentage |
|---|---|---|---|
| Higher | AMD Radeon RX 640 4GB (OEM) | 1650 GFLOPS | 100.4% |
| Higher | NVIDIA GeForce MX350 | 1992 GFLOPS | 121.2% |
| This Hardware | Intel Iris Xe Graphics Mobile (80EUs, Tiger Lake) | 1643 GFLOPS | 100% |
| Lower | Intel Iris Xe Graphics Mobile (80EUs, Raptor Lake) | 1506 GFLOPS | 91.7% |
| Lower | AMD Radeon Graphics Mobile (Lucienne, 384 Shaders) | 1149 GFLOPS | 69.9% |
Unigine Tropics
| Rank | Hardware | Score | Performance Percentage |
|---|---|---|---|
| Higher | NVIDIA GeForce MX350 | 3534 points | 148.9% |
| This Hardware | Intel Iris Xe Graphics Mobile (80EUs, Tiger Lake) | 2373 points | 100% |
| Lower | AMD Radeon HD 7310 | 33 points | 1.4% |
Geekbench6 - Compute
| Rank | Hardware | Score | Performance Percentage |
|---|---|---|---|
| Higher | Intel Iris Xe Graphics Mobile (80EUs, Raptor Lake) | 12092 points | 109.6% |
| Higher | NVIDIA GeForce MX350 | 14034 points | 127.2% |
| This Hardware | Intel Iris Xe Graphics Mobile (80EUs, Tiger Lake) | 11034 points | 100% |
| Lower | Intel HD Graphics 520 (Mobile) | 2845 points | 25.8% |
| Lower | Qualcomm Adreno 710 | 1729 points | 15.7% |
About Iris Xe Graphics Mobile (80EUs, Tiger Lake)
Intel Iris Xe Graphics G7 (80 EUs) Mobile is an integrated GPU that comes in the Intel Core i5-1135G7 processor, part of the Tiger Lake family (11th generation Intel Core) released in 2020. This GPU has 80 execution units (EUs) with a frequency of up to 1.3 GHz, and supports various modern graphics technologies such as DirectX 12, Vulkan, and OpenGL 4.6.
Built with 10nm SuperFin fabrication, Iris Xe offers major improvements in power efficiency and graphics performance over previous generations, such as Intel UHD Graphics. The graphics performance is capable enough for multimedia, productivity, and light to medium games. Games such as Valorant, Dota 2, CS:GO, and Genshin Impact can be run smoothly at 720p to 1080p resolution, using low to medium graphics settings.
In addition to light gaming, Intel Iris Xe is also perfect for digital content processing, such as light video editing, photo processing, and 4K video playback thanks to its hardware decoding and AI-based media enhancement features. Iris Xe also supports multi-monitor output and modern connectivity such as DisplayPort 1.4 and HDMI 2.0, making it an ideal choice for productive users who need display flexibility.
On laptops like the Lenovo IdeaPad Slim 3i 14ITL6 that use a Core i5-1135G7 with 12GB DDR4 dual channel RAM, Iris Xe performance is optimized thanks to higher memory bandwidth. Even though the laptop is also equipped with an NVIDIA GeForce MX350 discrete GPU, the Iris Xe Graphics G7 is still sufficient for daily needs without having to rely on the dGPU, thus saving power.
Overall, Intel Iris Xe Graphics G7 is Intel's best integrated GPU solution for mainstream laptops. The combination of solid performance, power efficiency, and support for the latest technologies makes it an ideal choice for users who want a modern graphics experience without having to have a separate graphics card.
Hardware Detail:
Device: Lenovo IdeaPad Slim 3i 14ITL6
CPU: Core i5-1135G7
dGPU: GeForce MX350
RAM: 12GB DDR4 3200MHz Dual Channel (8+4)
OS: Windows 10, Windows 11 22H2
Need Compare to Other Hardware?
You can compare Intel Iris Xe Graphics Mobile (80EUs, Tiger Lake) hardware with related hardware below


Related Hardware
Explore other Videocards hardware that are related to Intel Iris Xe Graphics Mobile (80EUs, Tiger Lake)