
CINEBENCH - R23 MULTI CORE
4
of Total Submissions
27301 pts
of Total Score
Thursday, 01 January 1970 07:00 | Updated at 1 month ago
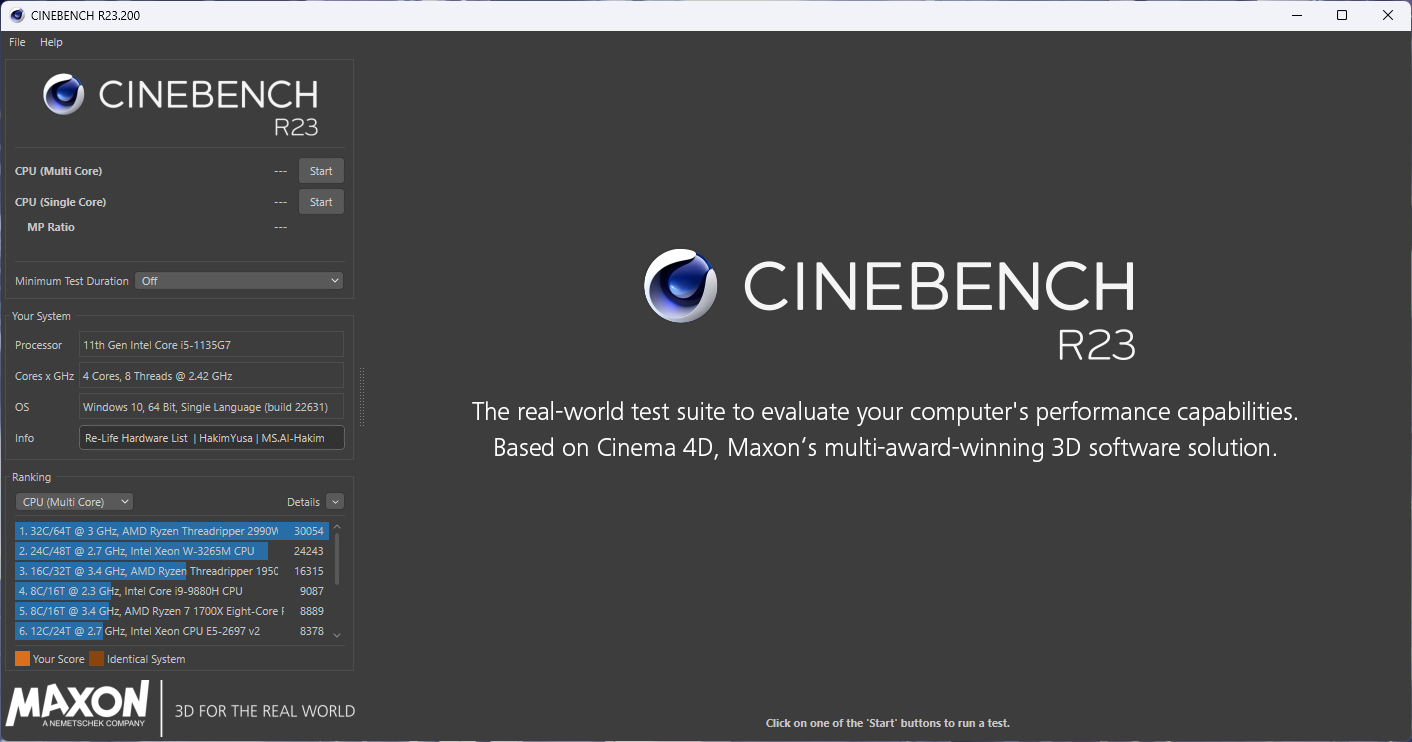
About Cinebench - R23 Multi Core
Cinebench R23 Multi Core is a popular benchmark designed to test processor performance in heavy-duty workloads that fully utilize all available cores and threads. Developed by Maxon, the creator of the professional animation and rendering software Cinema 4D, Cinebench R23 uses the latest rendering engine, which demands high processing power from the CPU to complete complex rendering tasks with photorealistic results.
In this multi-core test, Cinebench R23 applies an intensive workload resembling real-world 3D rendering projects involving millions of polygons, realistic lighting, complex materials, and other visual effects. The processor is pushed to operate at maximum capacity, and the higher the number of cores and the efficiency of the CPU architecture, the faster the rendering results can be completed. Benchmark results are displayed in points (pts)—the higher the number, the better the CPU's overall performance in handling multi-threaded workloads.
Cinebench R23 also introduces longer and more stable testing compared to the previous version (R20), with a longer benchmark duration. This provides a more accurate picture of the processor's performance under long-term workloads, while also showing how well the system can maintain performance without throttling due to temperature or power.
This benchmark is ideal for professional users, content creators, and developers who require high-performance CPUs for tasks such as video rendering, physics simulations, scientific computing, and parallel programming. Cinebench R23 Multi Core has become one of the industry's primary benchmarks for evaluating a processor's multitasking capabilities and overall processing power.
Benchmark Cinebench - R23 Multi Core Chart Ranking
The following graph displays the hardware performance ranking based on benchmark results using Cinebench - R23 Multi Core. The data is organized from highest to lowest score for easy visual comparison between devices. You can hover over each bar to view the score details and associated hardware name.
Benchmark Cinebench - R23 Multi Core Table Ranking
The following table presents hardware rankings based on benchmark results using Cinebench - R23 Multi Core. The table format provides detailed views such as device name, score, number of submissions, as well as links to test results. It's perfect for those who want to see detailed data and easily search or filter.
| No. | Hardware | Submissions from Cinebench - R23 Multi Core |
|---|---|---|
| 1 | Intel Core i7 11700 | 11206 pts |
| 2 | Intel Core i7 7700K | 5767 pts |
| 3 | Intel Core i5 1135G7 | 5181 pts |
| 4 | AMD Ryzen 3 5300U | 5147 pts |